Plotting Commands
In order to enhance modified base detection and give users a better grasp of raw nanopore data, Tombo provides a number of raw signal plotting commands.
Genome Anchored Plotting
Plot Region Selection
Most Tombo plotting functions are genome-anchored. These commands create plots analogous to a genome browser, but including all raw signal within a region. The available commands differ in their mode of genome region selection. This allows users to plot regions of interest for many research contexts.
tombo plot max_coverage- Select regions with maximal coveragetombo plot genome_location- Select specified genomic locationstombo plot motif_centered- Select regions with a specific motif (follows NEB single letter codes)tombo plot max_difference- Select regions where two samples’ average signal differs mosttombo plot most_significant- Select most consistently/significantly mofidied locations
These plotting commands produce raw signal level plots such at the example below. Options are available for each of these plots to logically select genomic regions based on the given criterion.
Note
All genome-anchored plots use 1-based coordinate systems (similar to the majority of genome browsers).
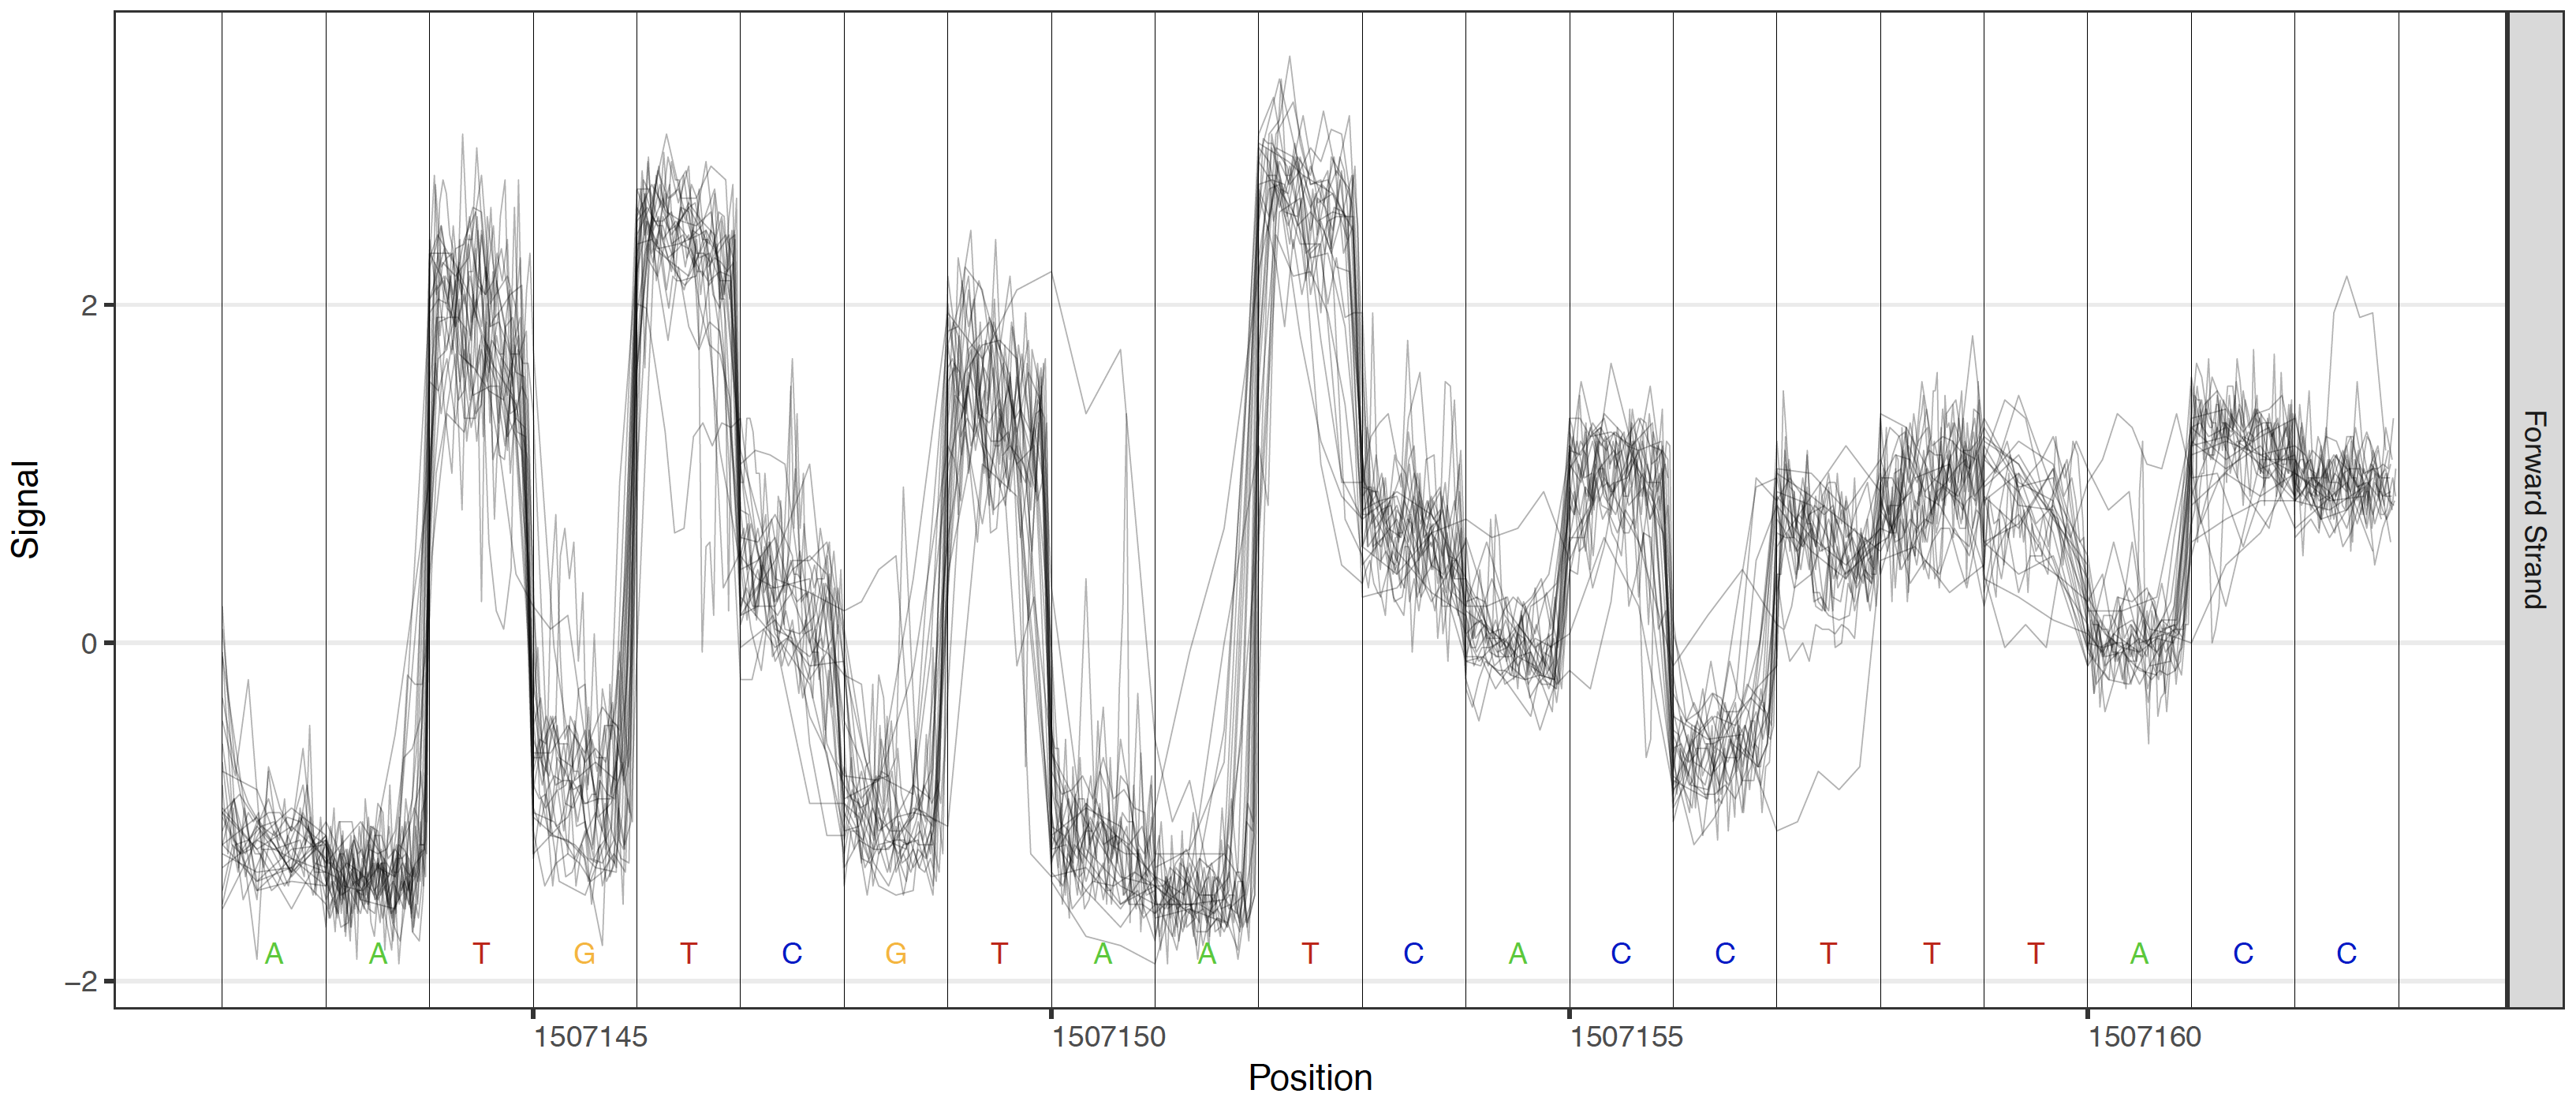
Single sample raw signal plot
Model Plotting
Plots are also enabled to visualize the different testing frameworks available in Tombo. These include options to add a control sample’s raw signal, the canonical model or any alternative base model.
Control these plots with these options: --control-fast5-basedirs, --plot-standard-model, --plot-alternate-model 5mC, --tombo-model-filename, and --alternate-model-filename.
For alternative model plotting (--plot-alternate-model), note that, as of v1.5, alternative models are spcified for a specific position within each label. Thus a global alternative model cannot be plotted. As such, the alternative model is only displayed around the central base in each plot and only when applicable (i.e. the cetnral base fits the model motif). So the alternative levels may not appear for some regions when a plot specifies the alternative model option. The alternative model levels should always be plotted when plotting using the tombo plot most_significant command and specifying the same model used in the tombo detect_modifications call.
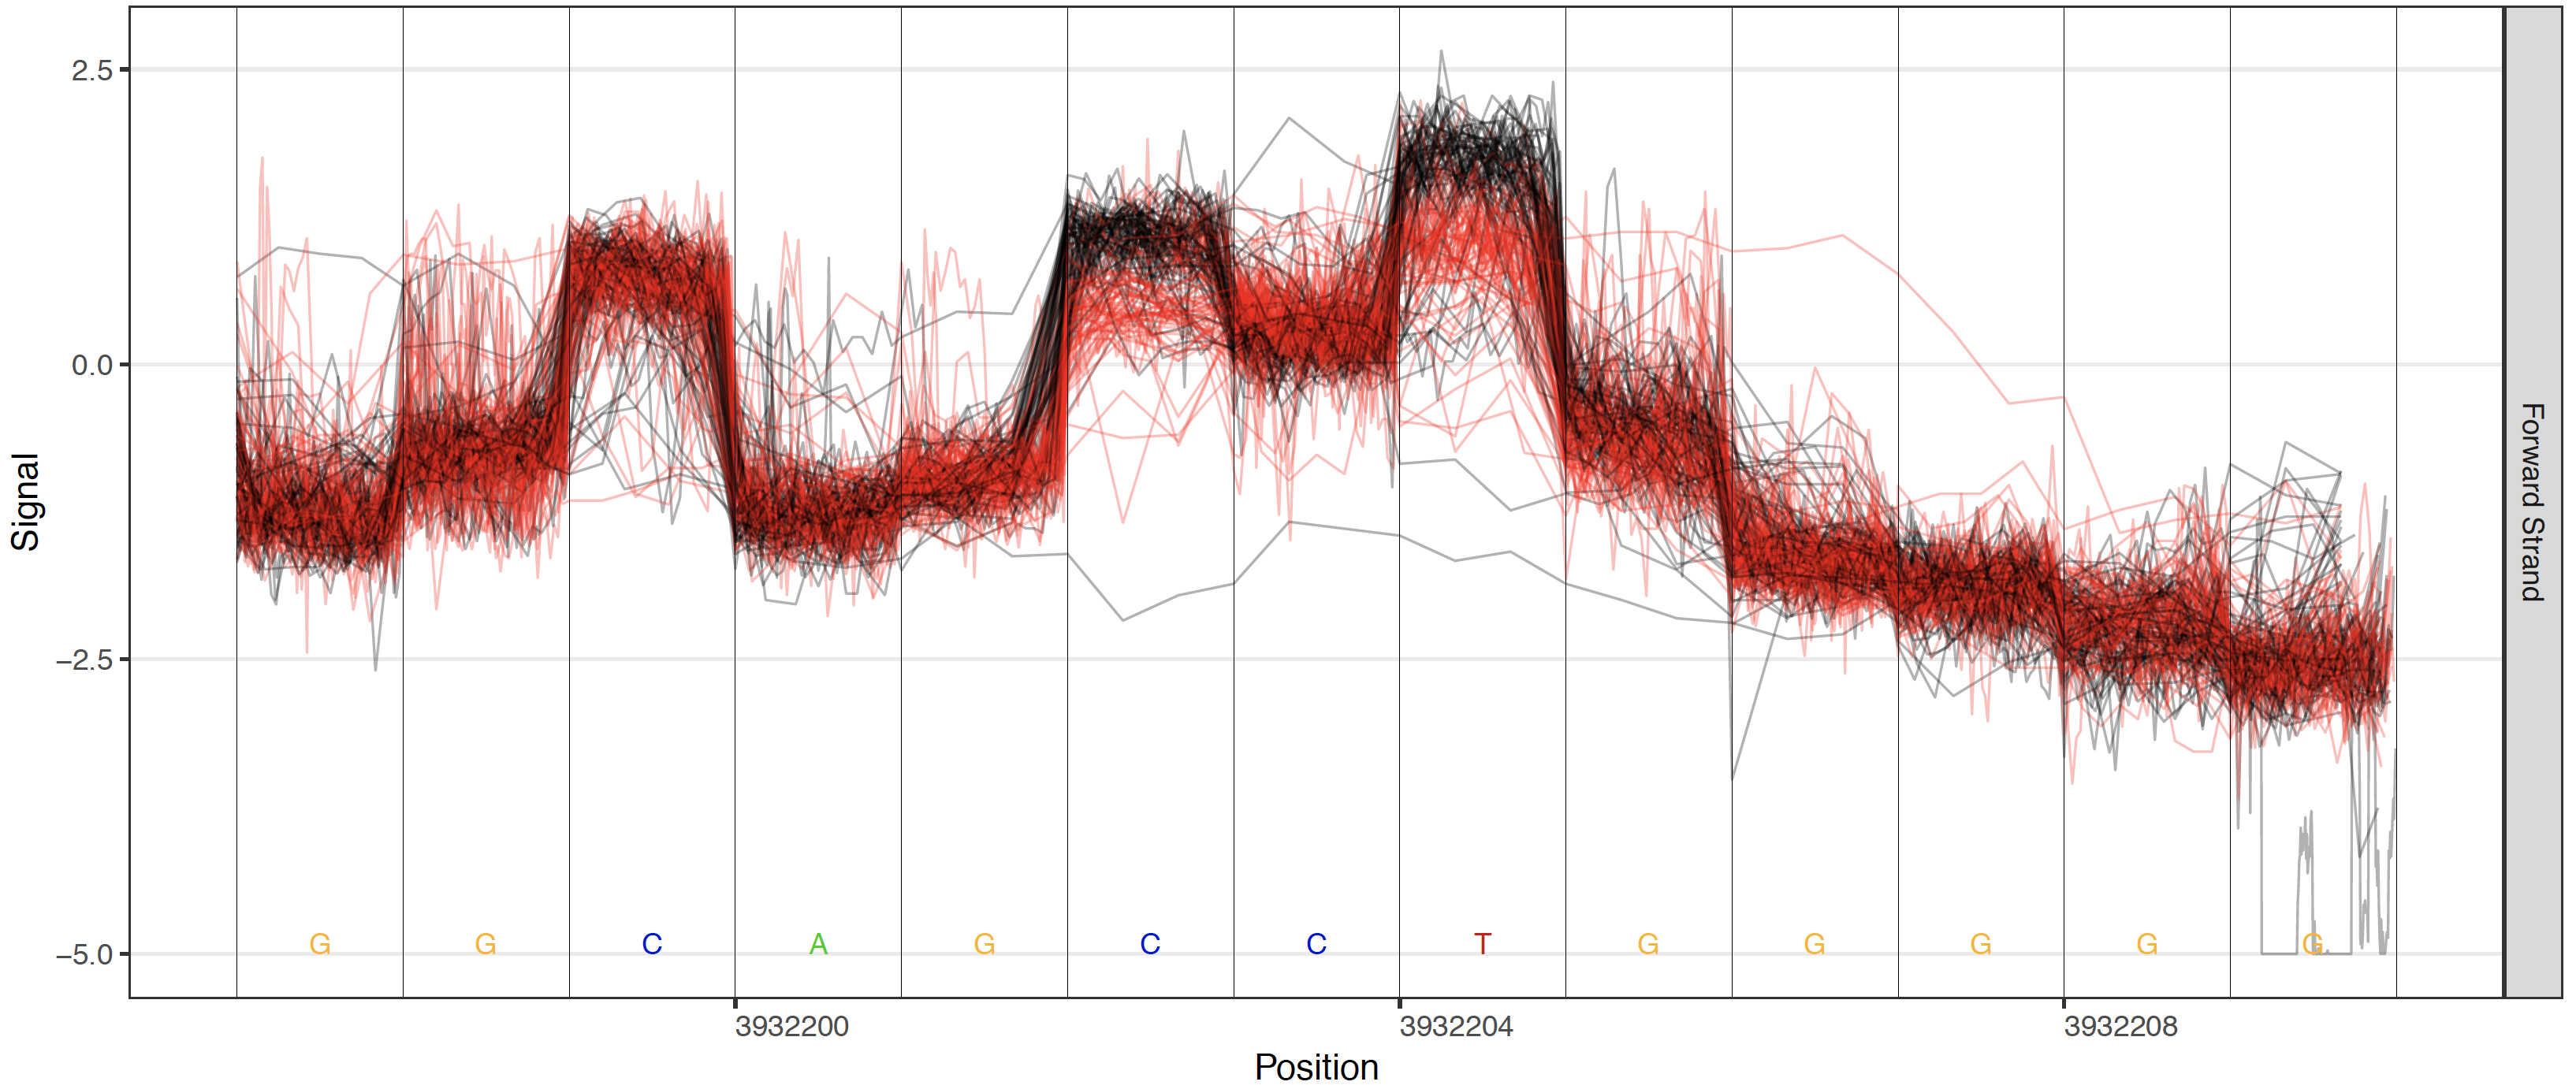
Control sample comparison plot
Canonical model plot
Alternate model plot
Over-Plotting
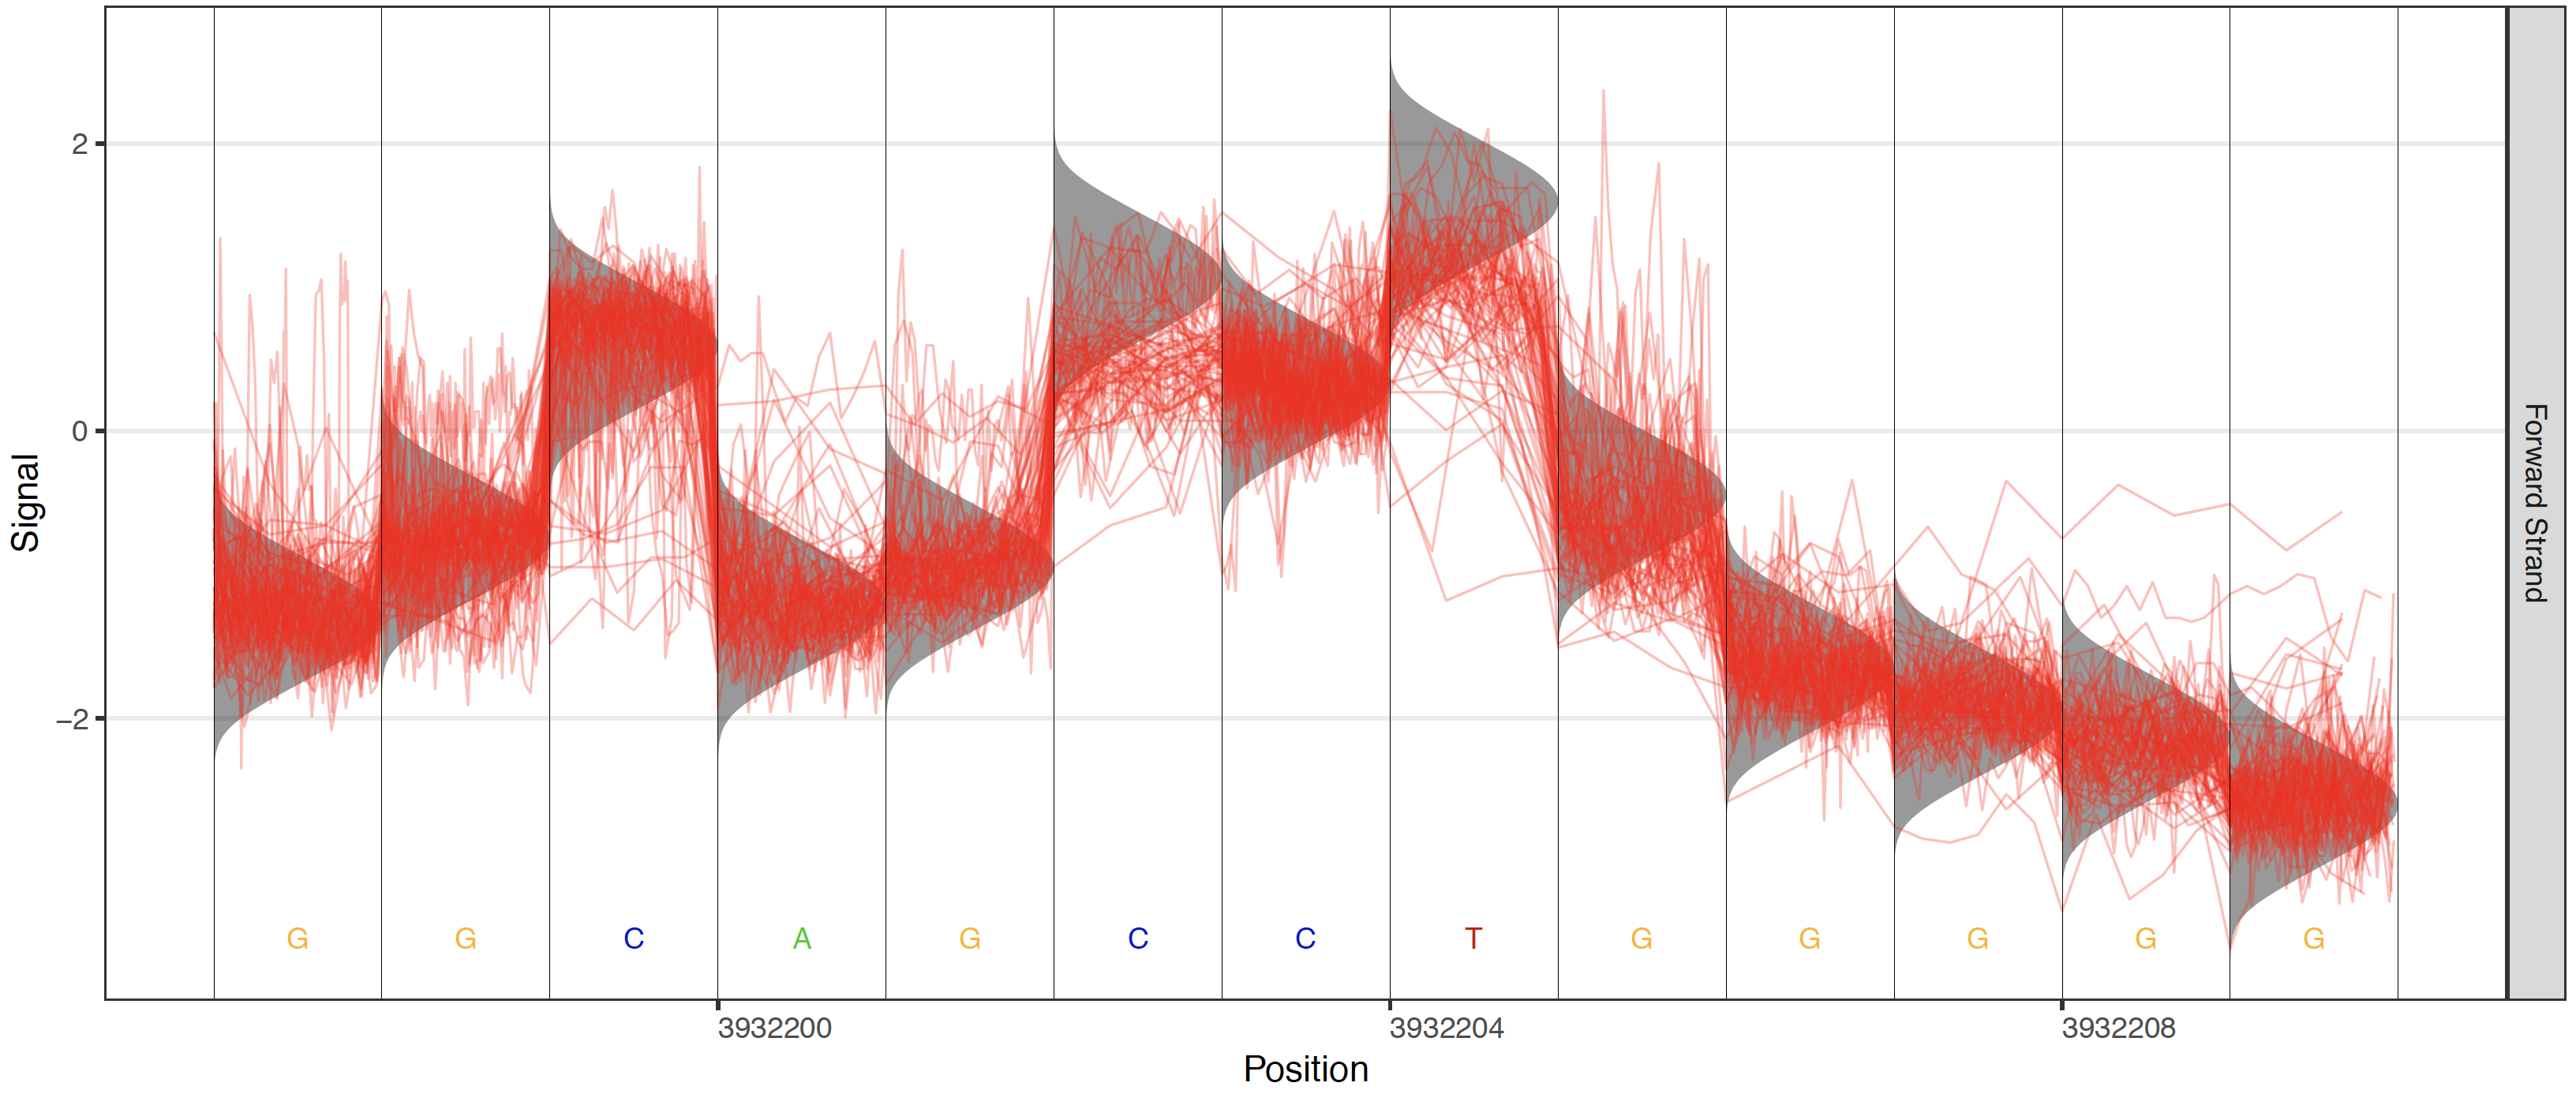
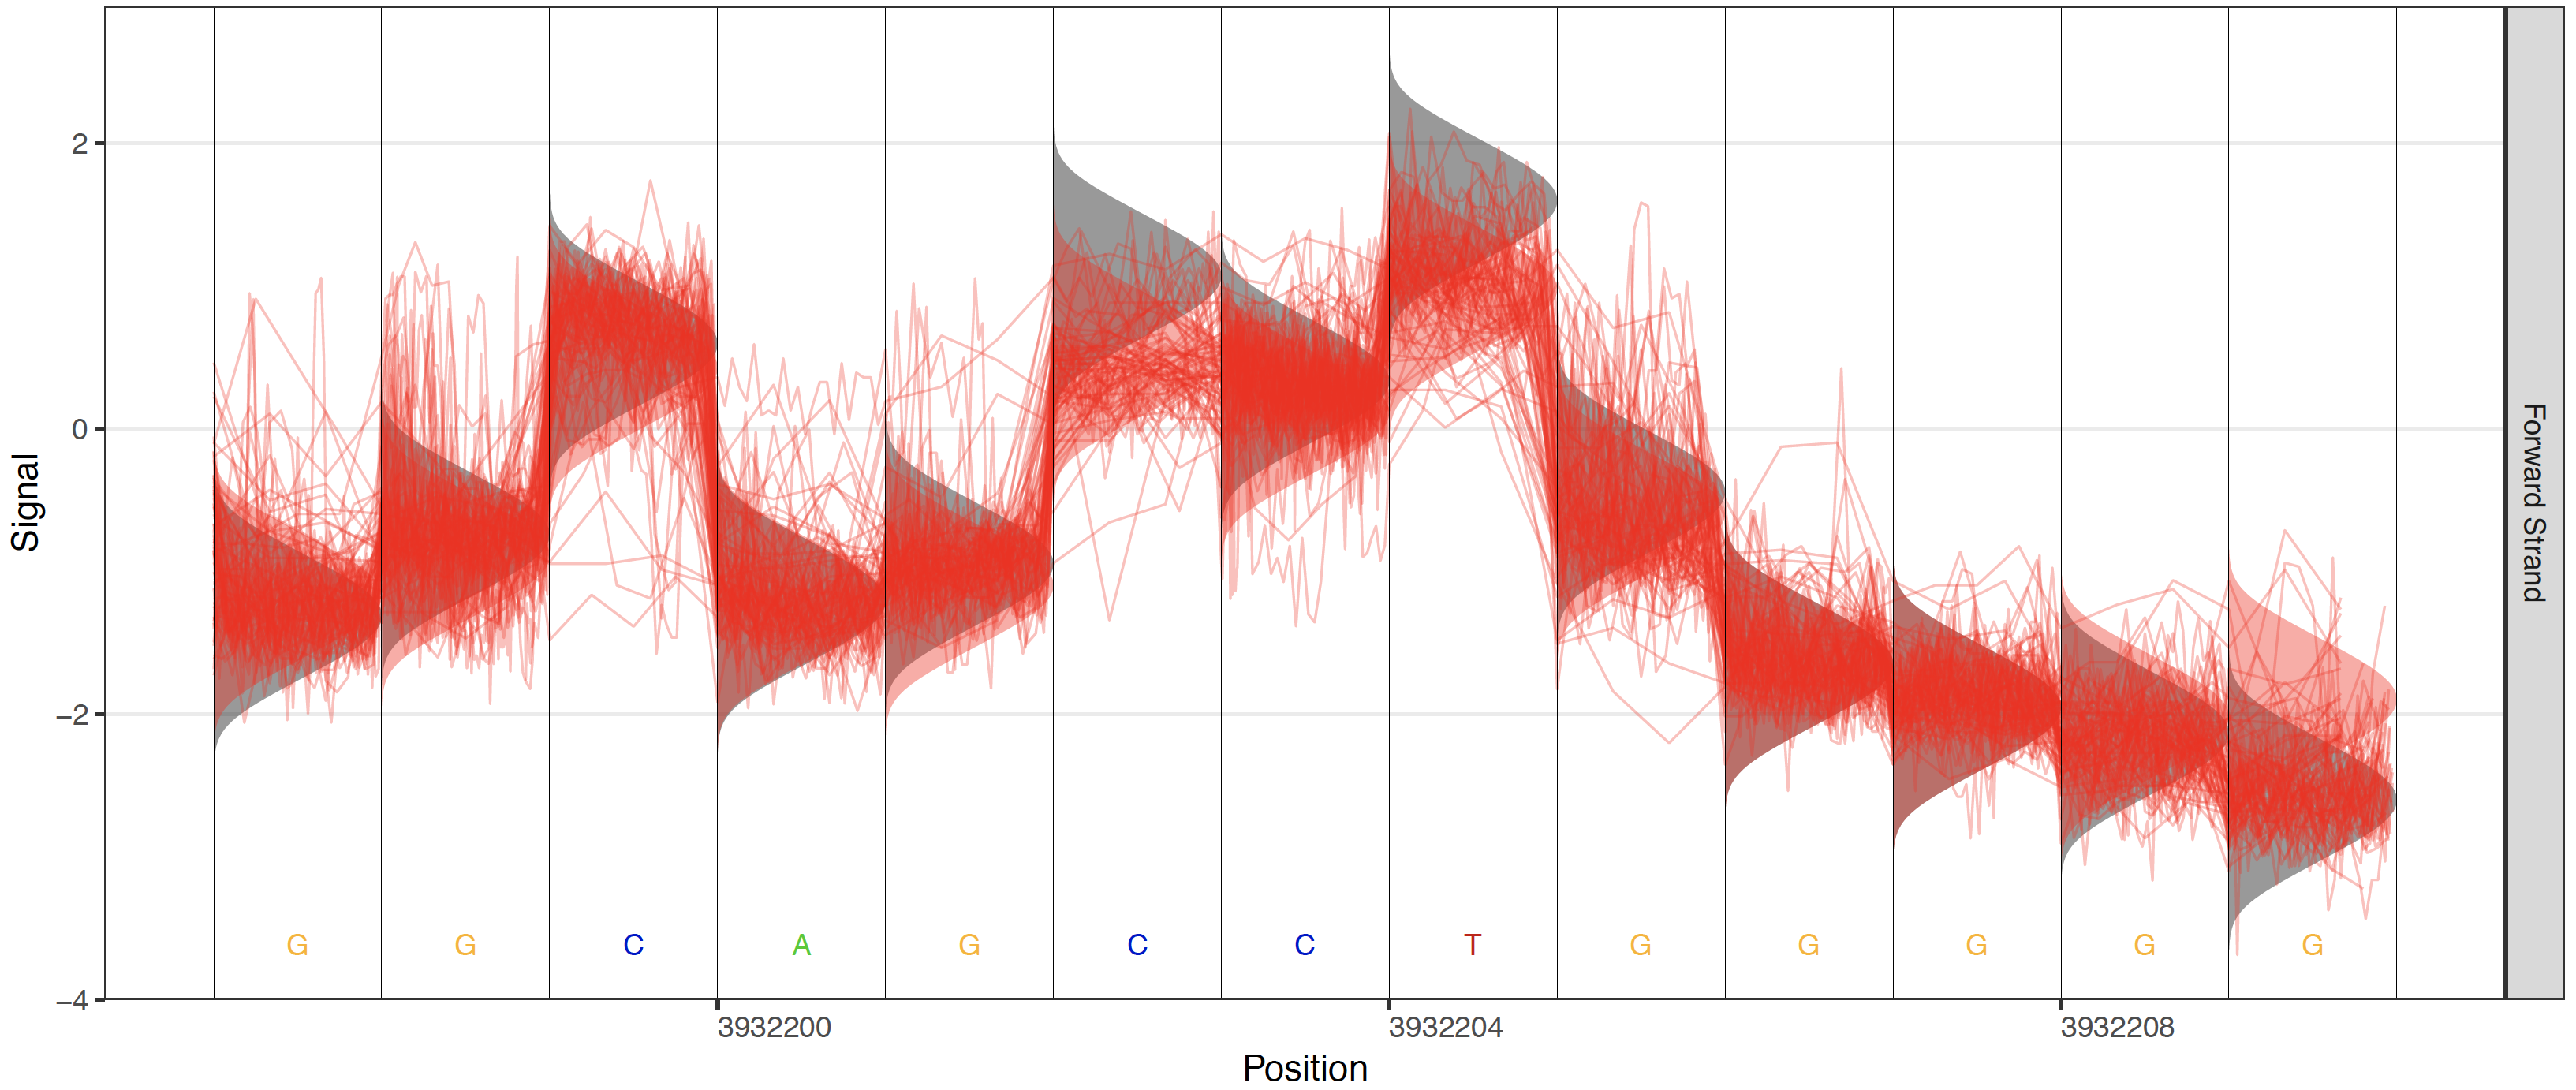
When high coverage regions are plotted, the raw signal plots can become less interpretable and inflate PDF file sizes. By default, when read coverage exceeds 50X reads are randomly downsampled to 50X coverage (change this threshold with the --overplot-threshold option). Three additional over-plotting types (boxplot, quantile and density) are available as shown below (chose which over-plotting type to use with the --overplot-type option).
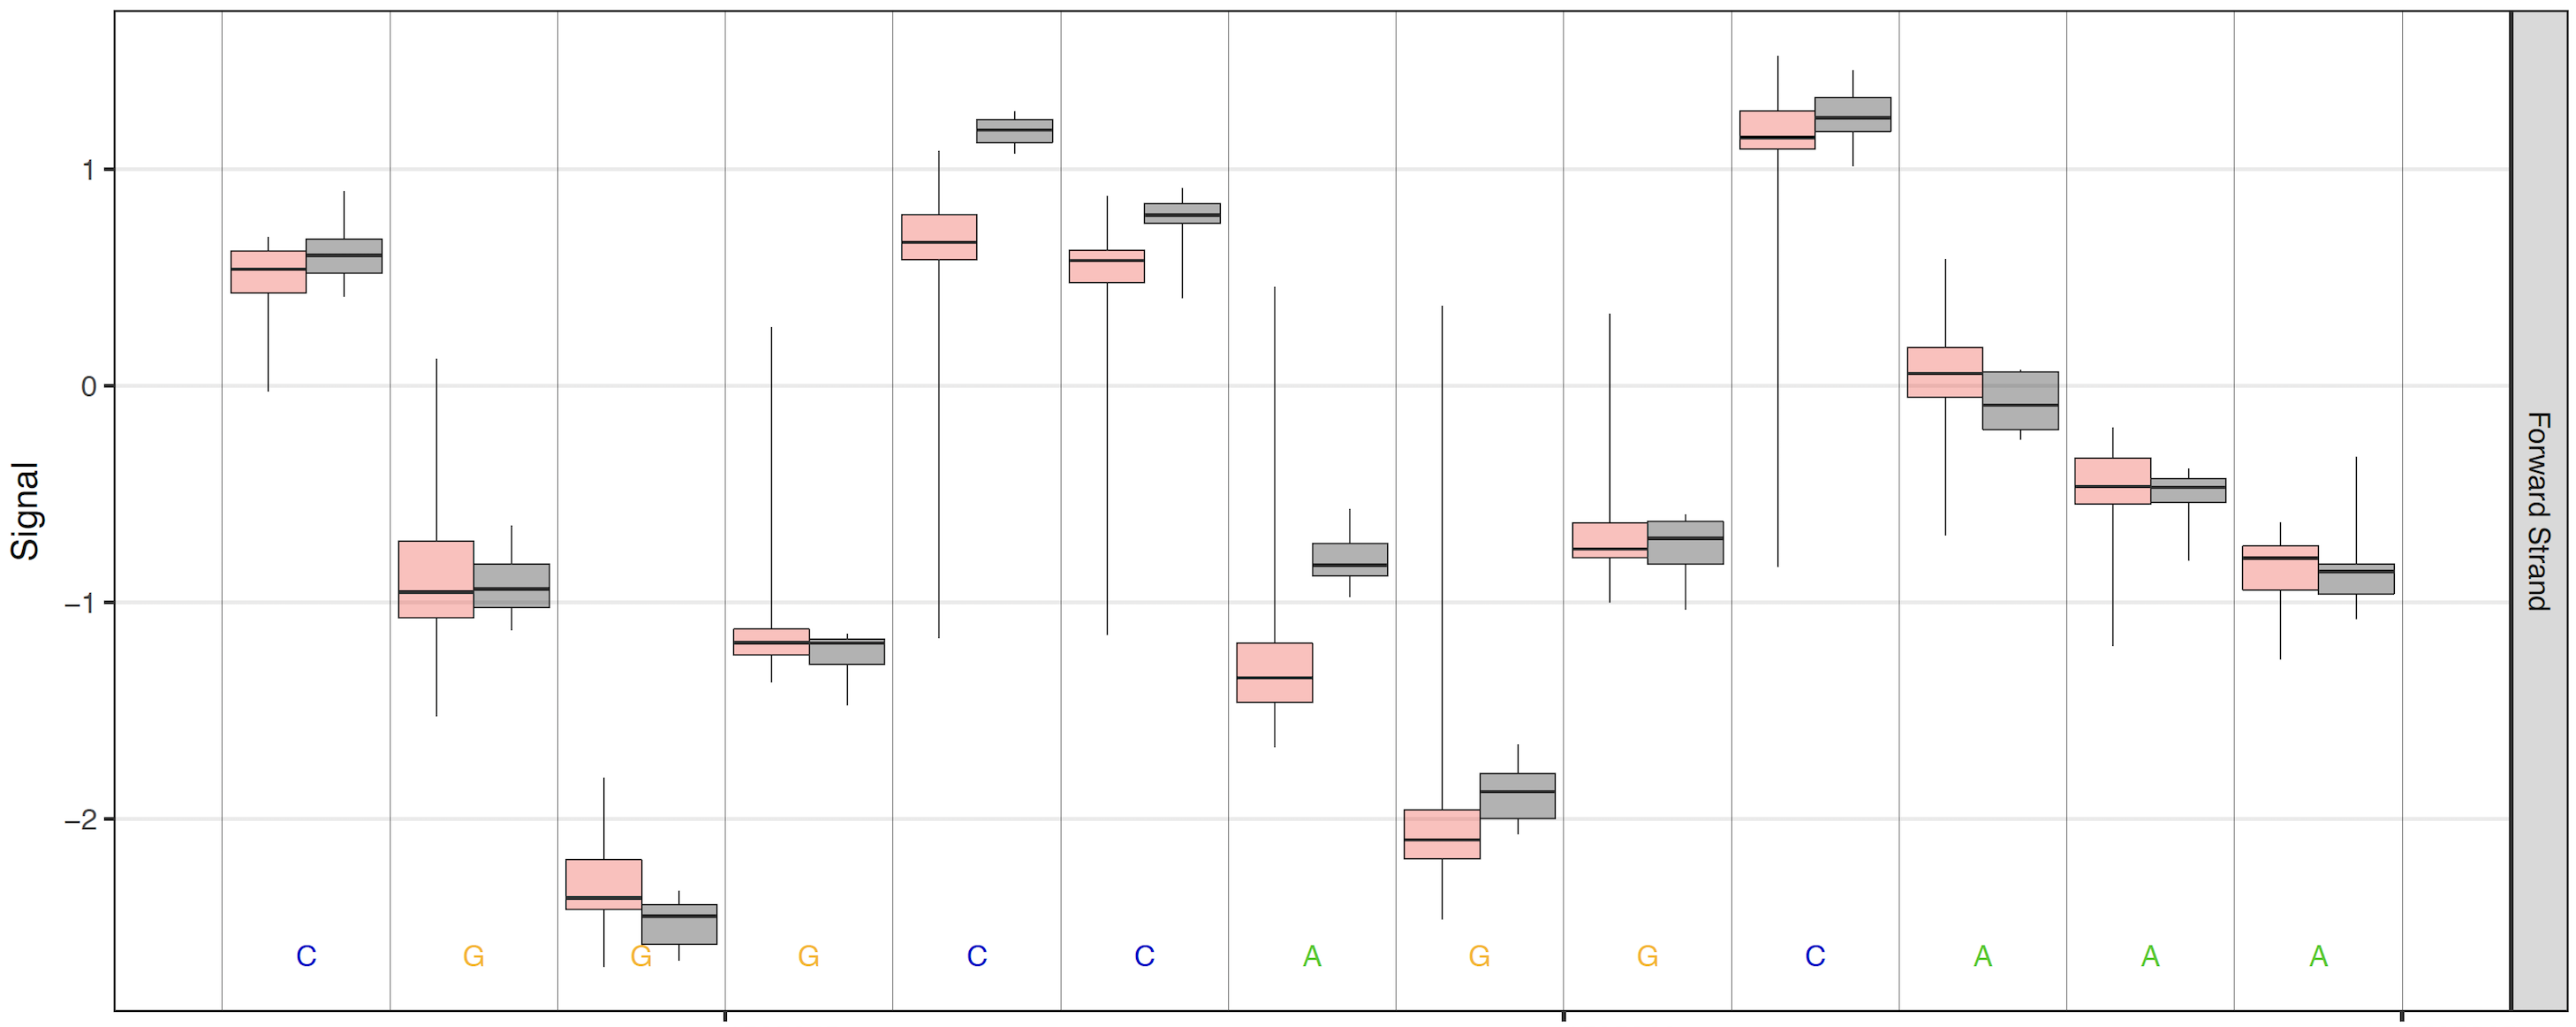
Boxplot over-plotting option
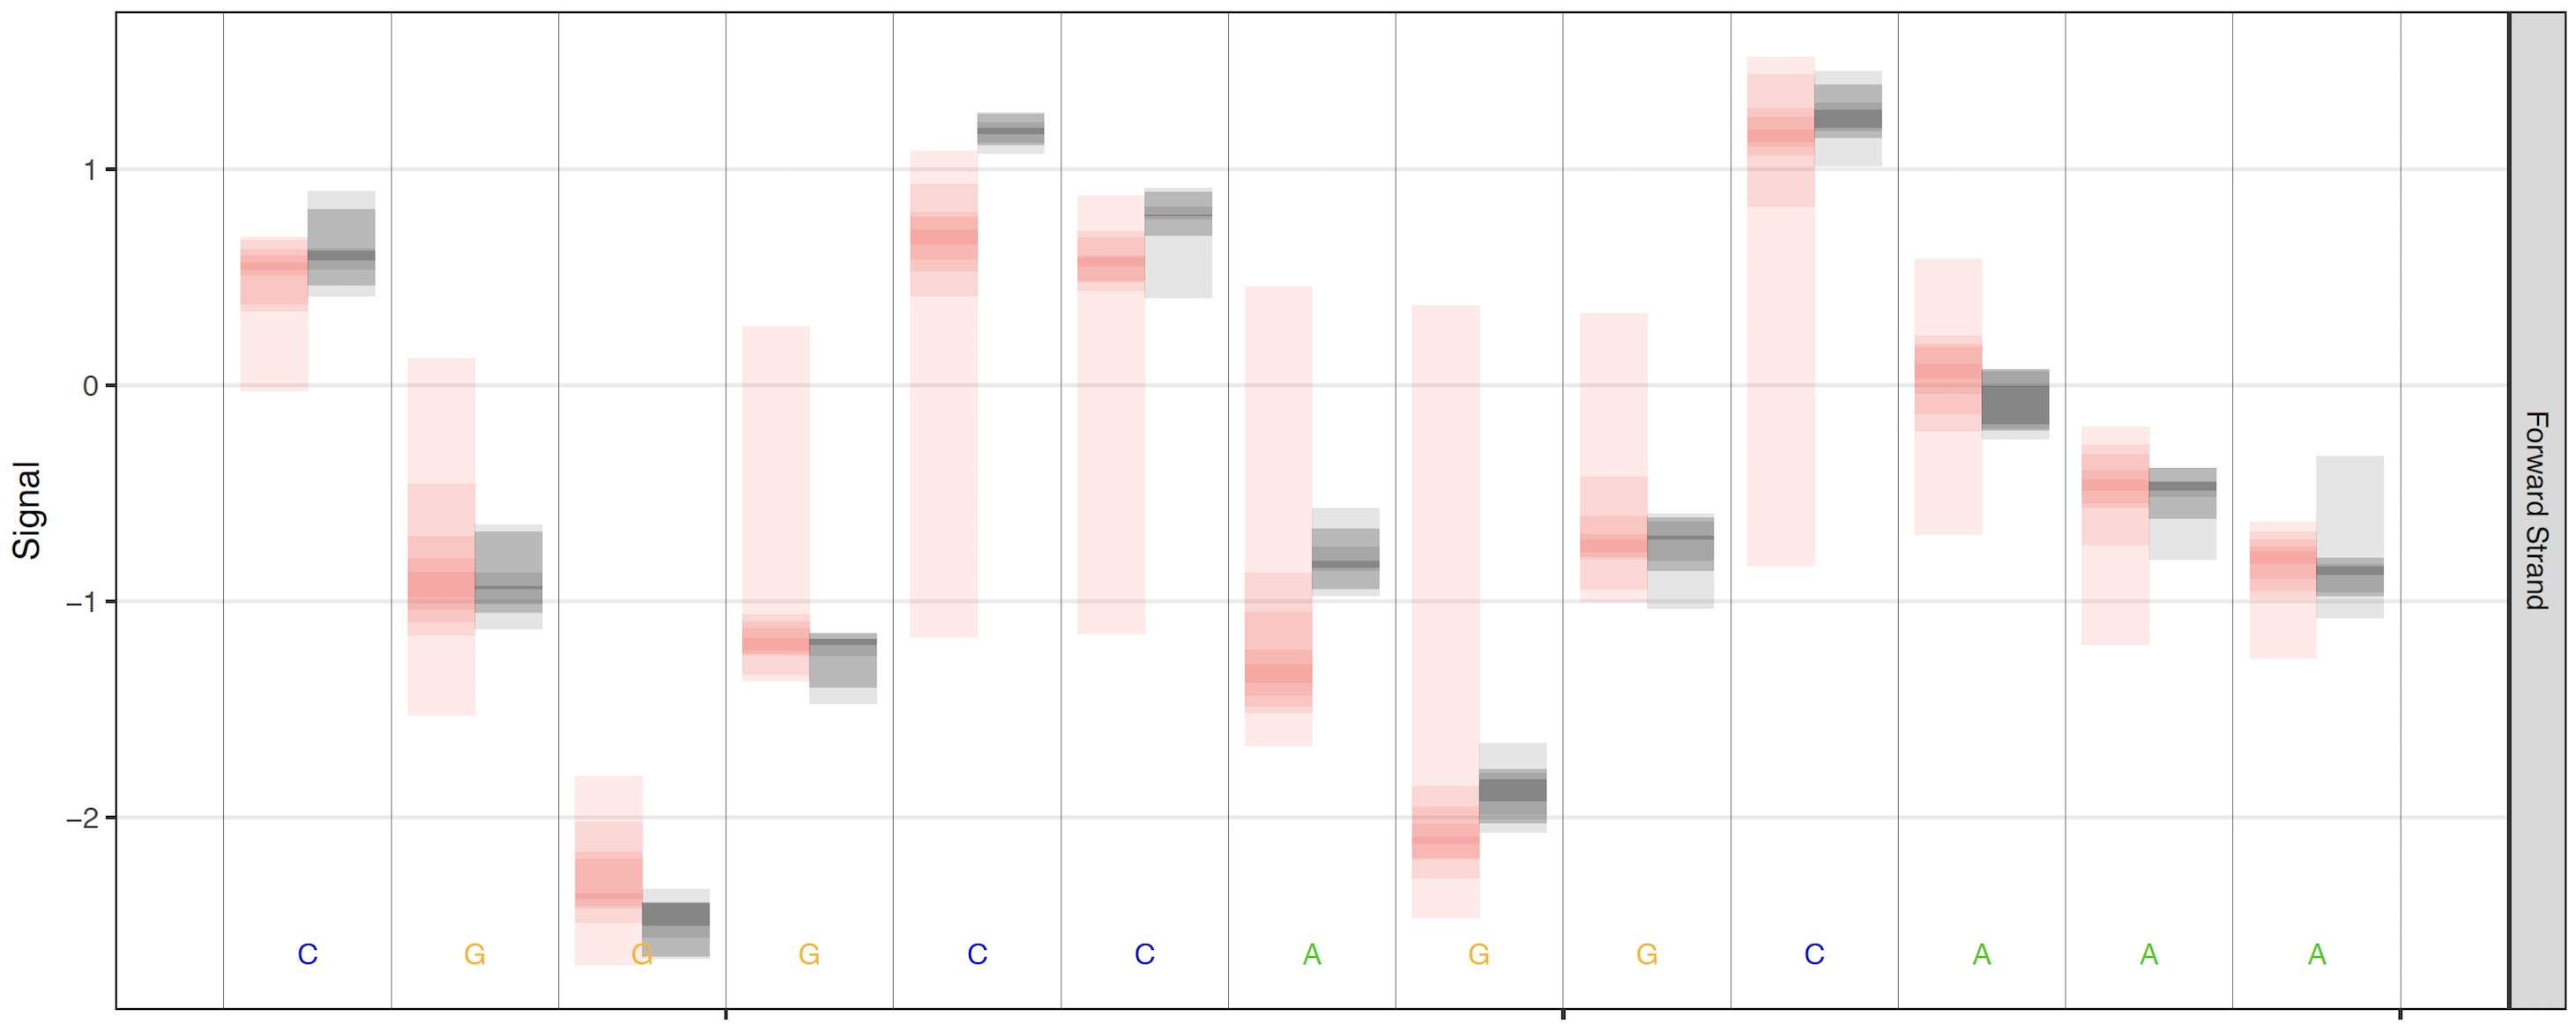
Quantile over-plotting option
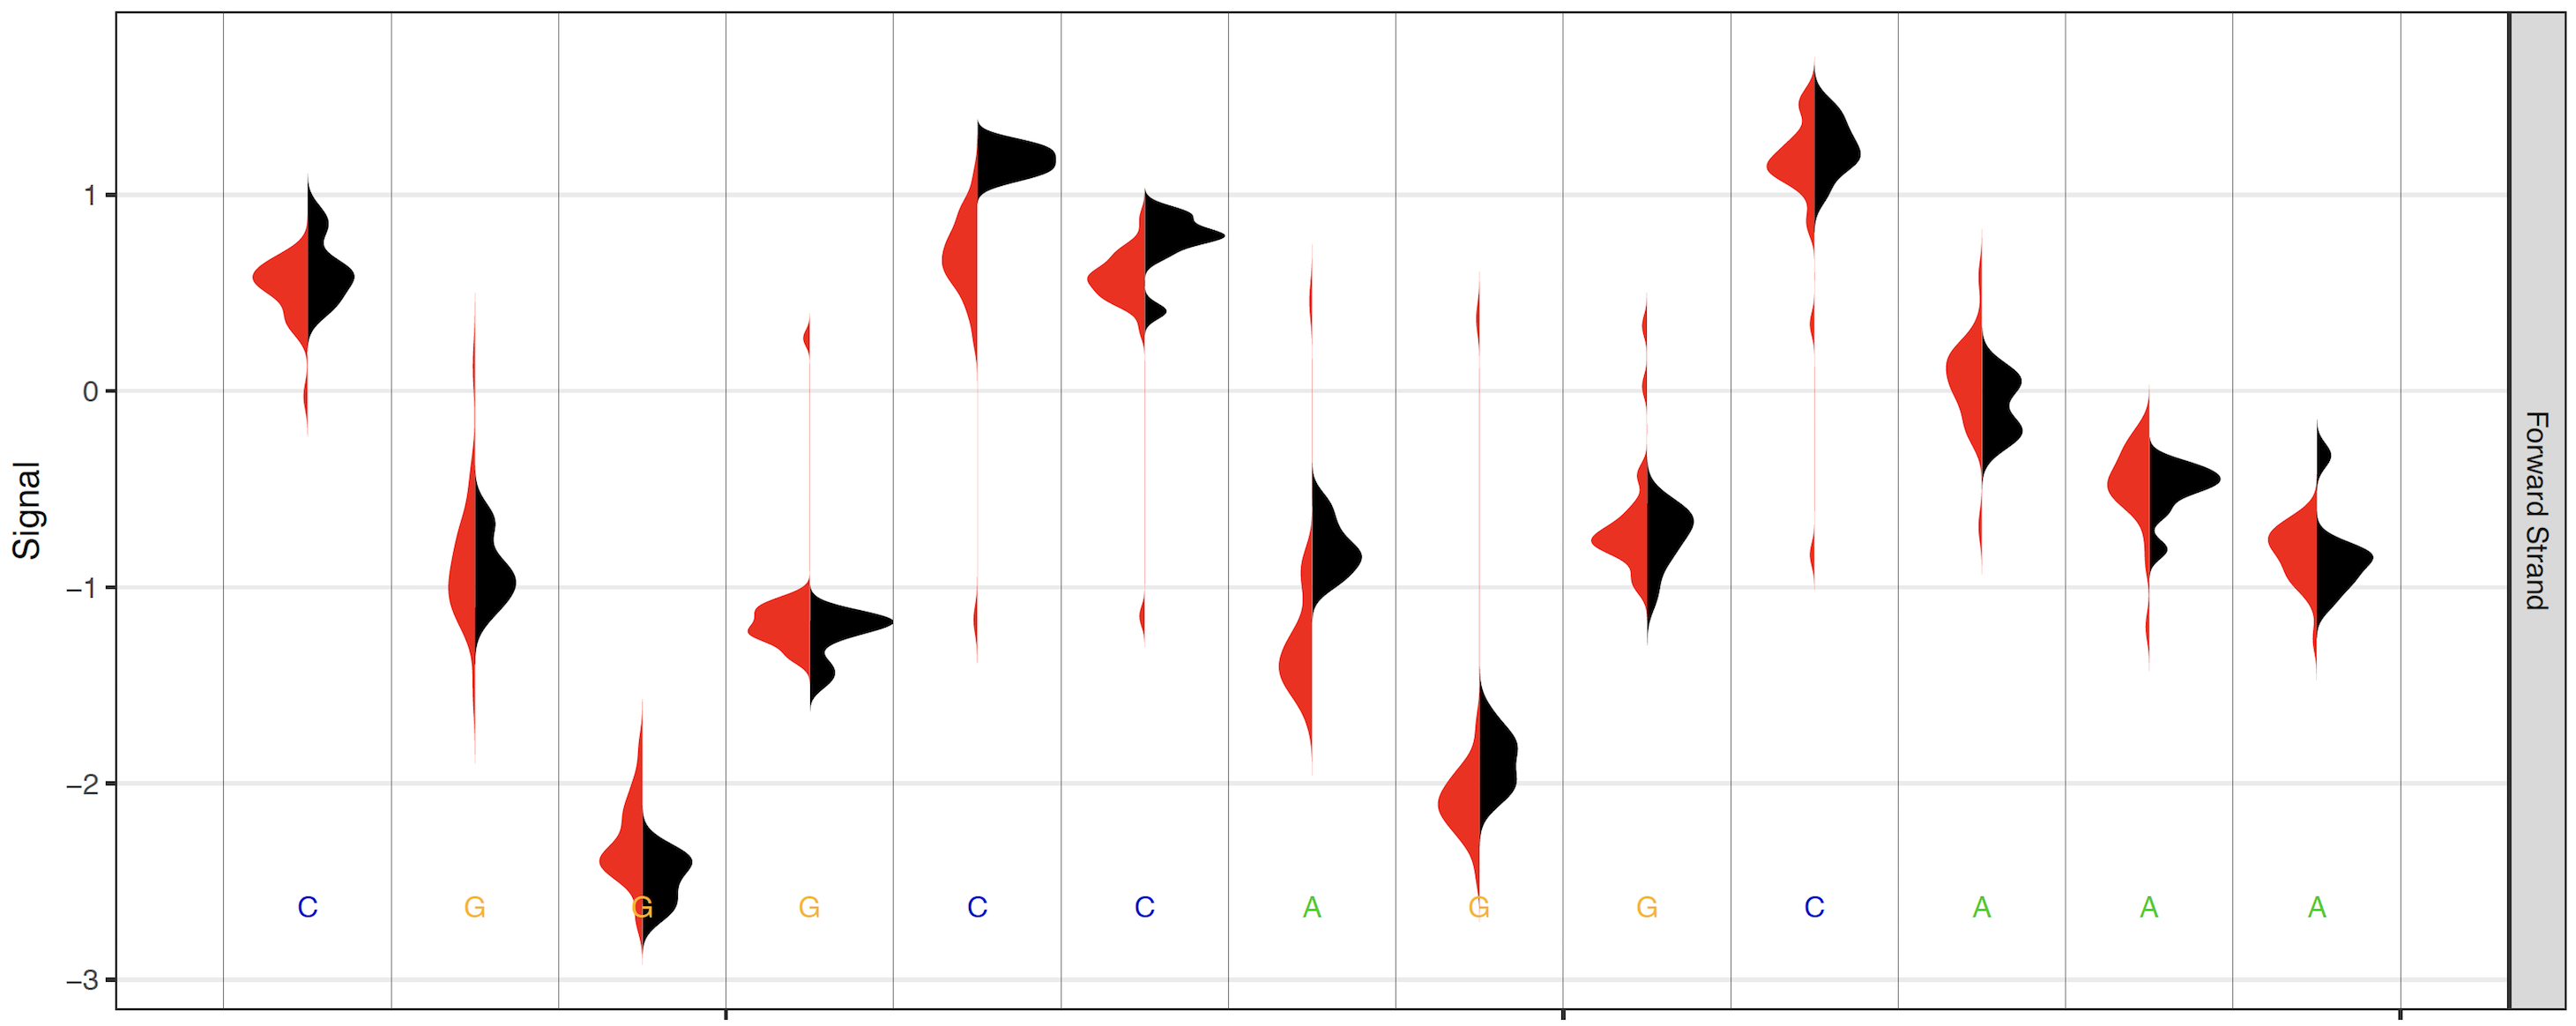
Density over-plotting option
Per-read Statistic Plotting
All testing in the Tombo framework is applied first on a per-read basis; to visualize these per-read results, per-read statistic plots are available. Per-read statistics are an optional output from any detect_modifications command via the --per-read-statistics-filename option, and the output file specified by this option is required in order to the plot per-read statistics command. Create these plots with the tombo plot per_read command.
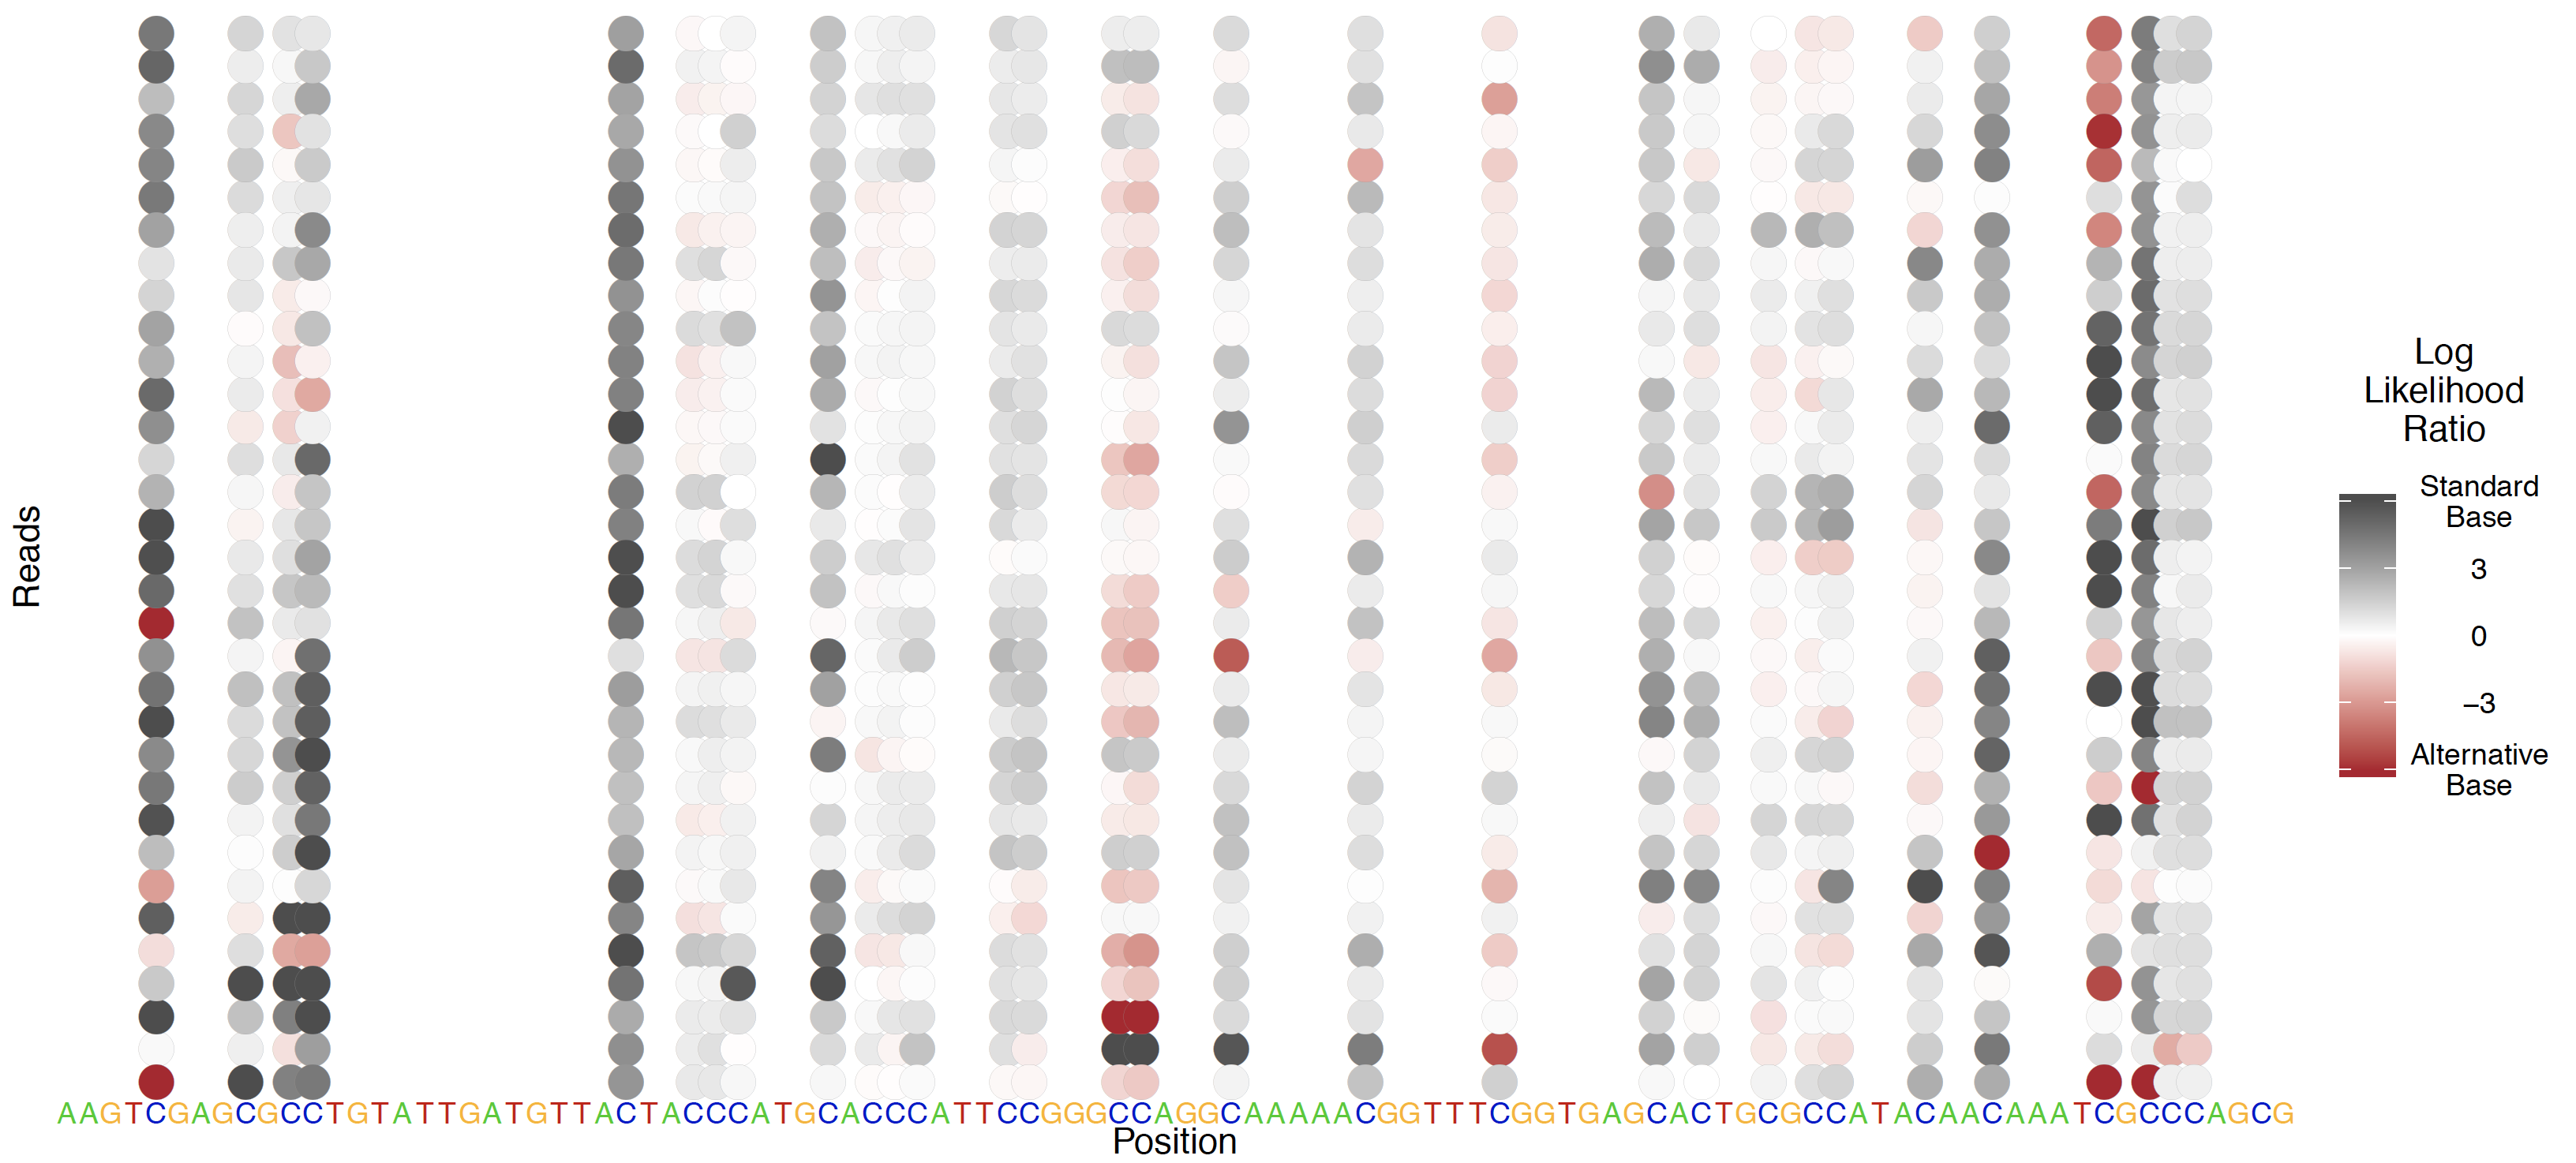
Alternative 5mC model testing
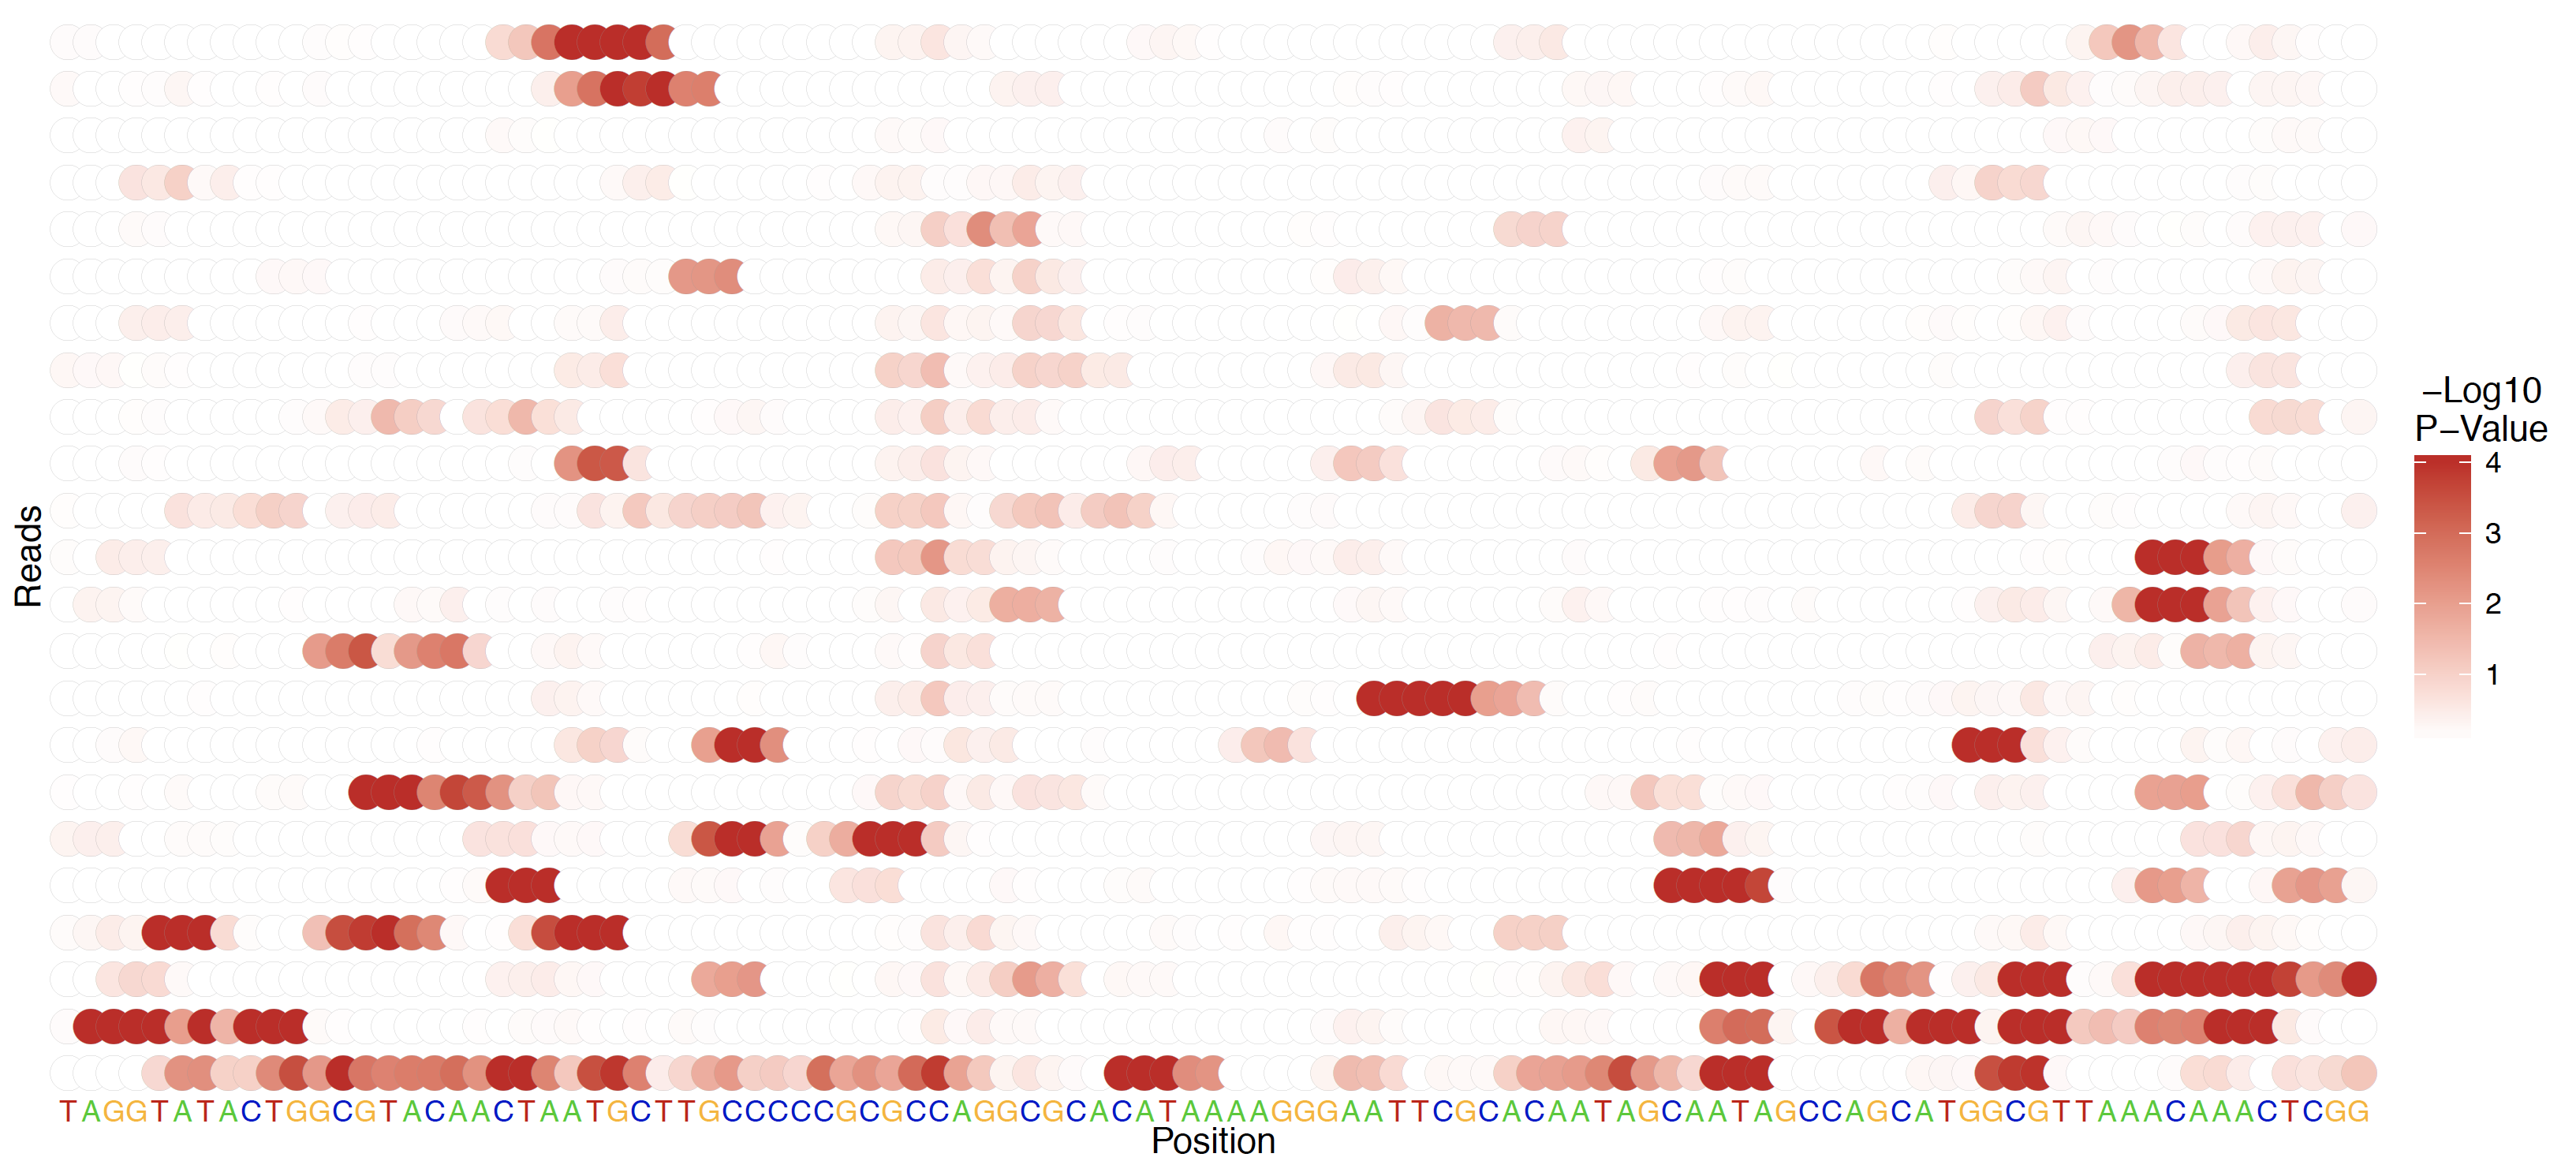
De novo, standard model, per-read testing
Motif-centered Statistic Plotting
In several biological contexts base modifications occur at specific motifs. In order to visualize the distribution of Tombo statistical test results centered on a motif of biolgical interest (or a discovered motif) the tombo plot motif_with_stats command is provided.
This command identifies a number (defined by --num-statistics) of genomic regions centered on this motif with the highest significance testing values. Importantly, the identified highest testing values need not be found within the actual motif, but simply within a region containing the motif defined by --num-context. In this way, non-interesting motifs (motifs which don’t direct modifications) will not contain more significant statistics centered on a specific position within the provided motif. A number (defined by --num-regions) of example regions with the highest test statistics centered on the motif of interest are added at the top portion of this plot.
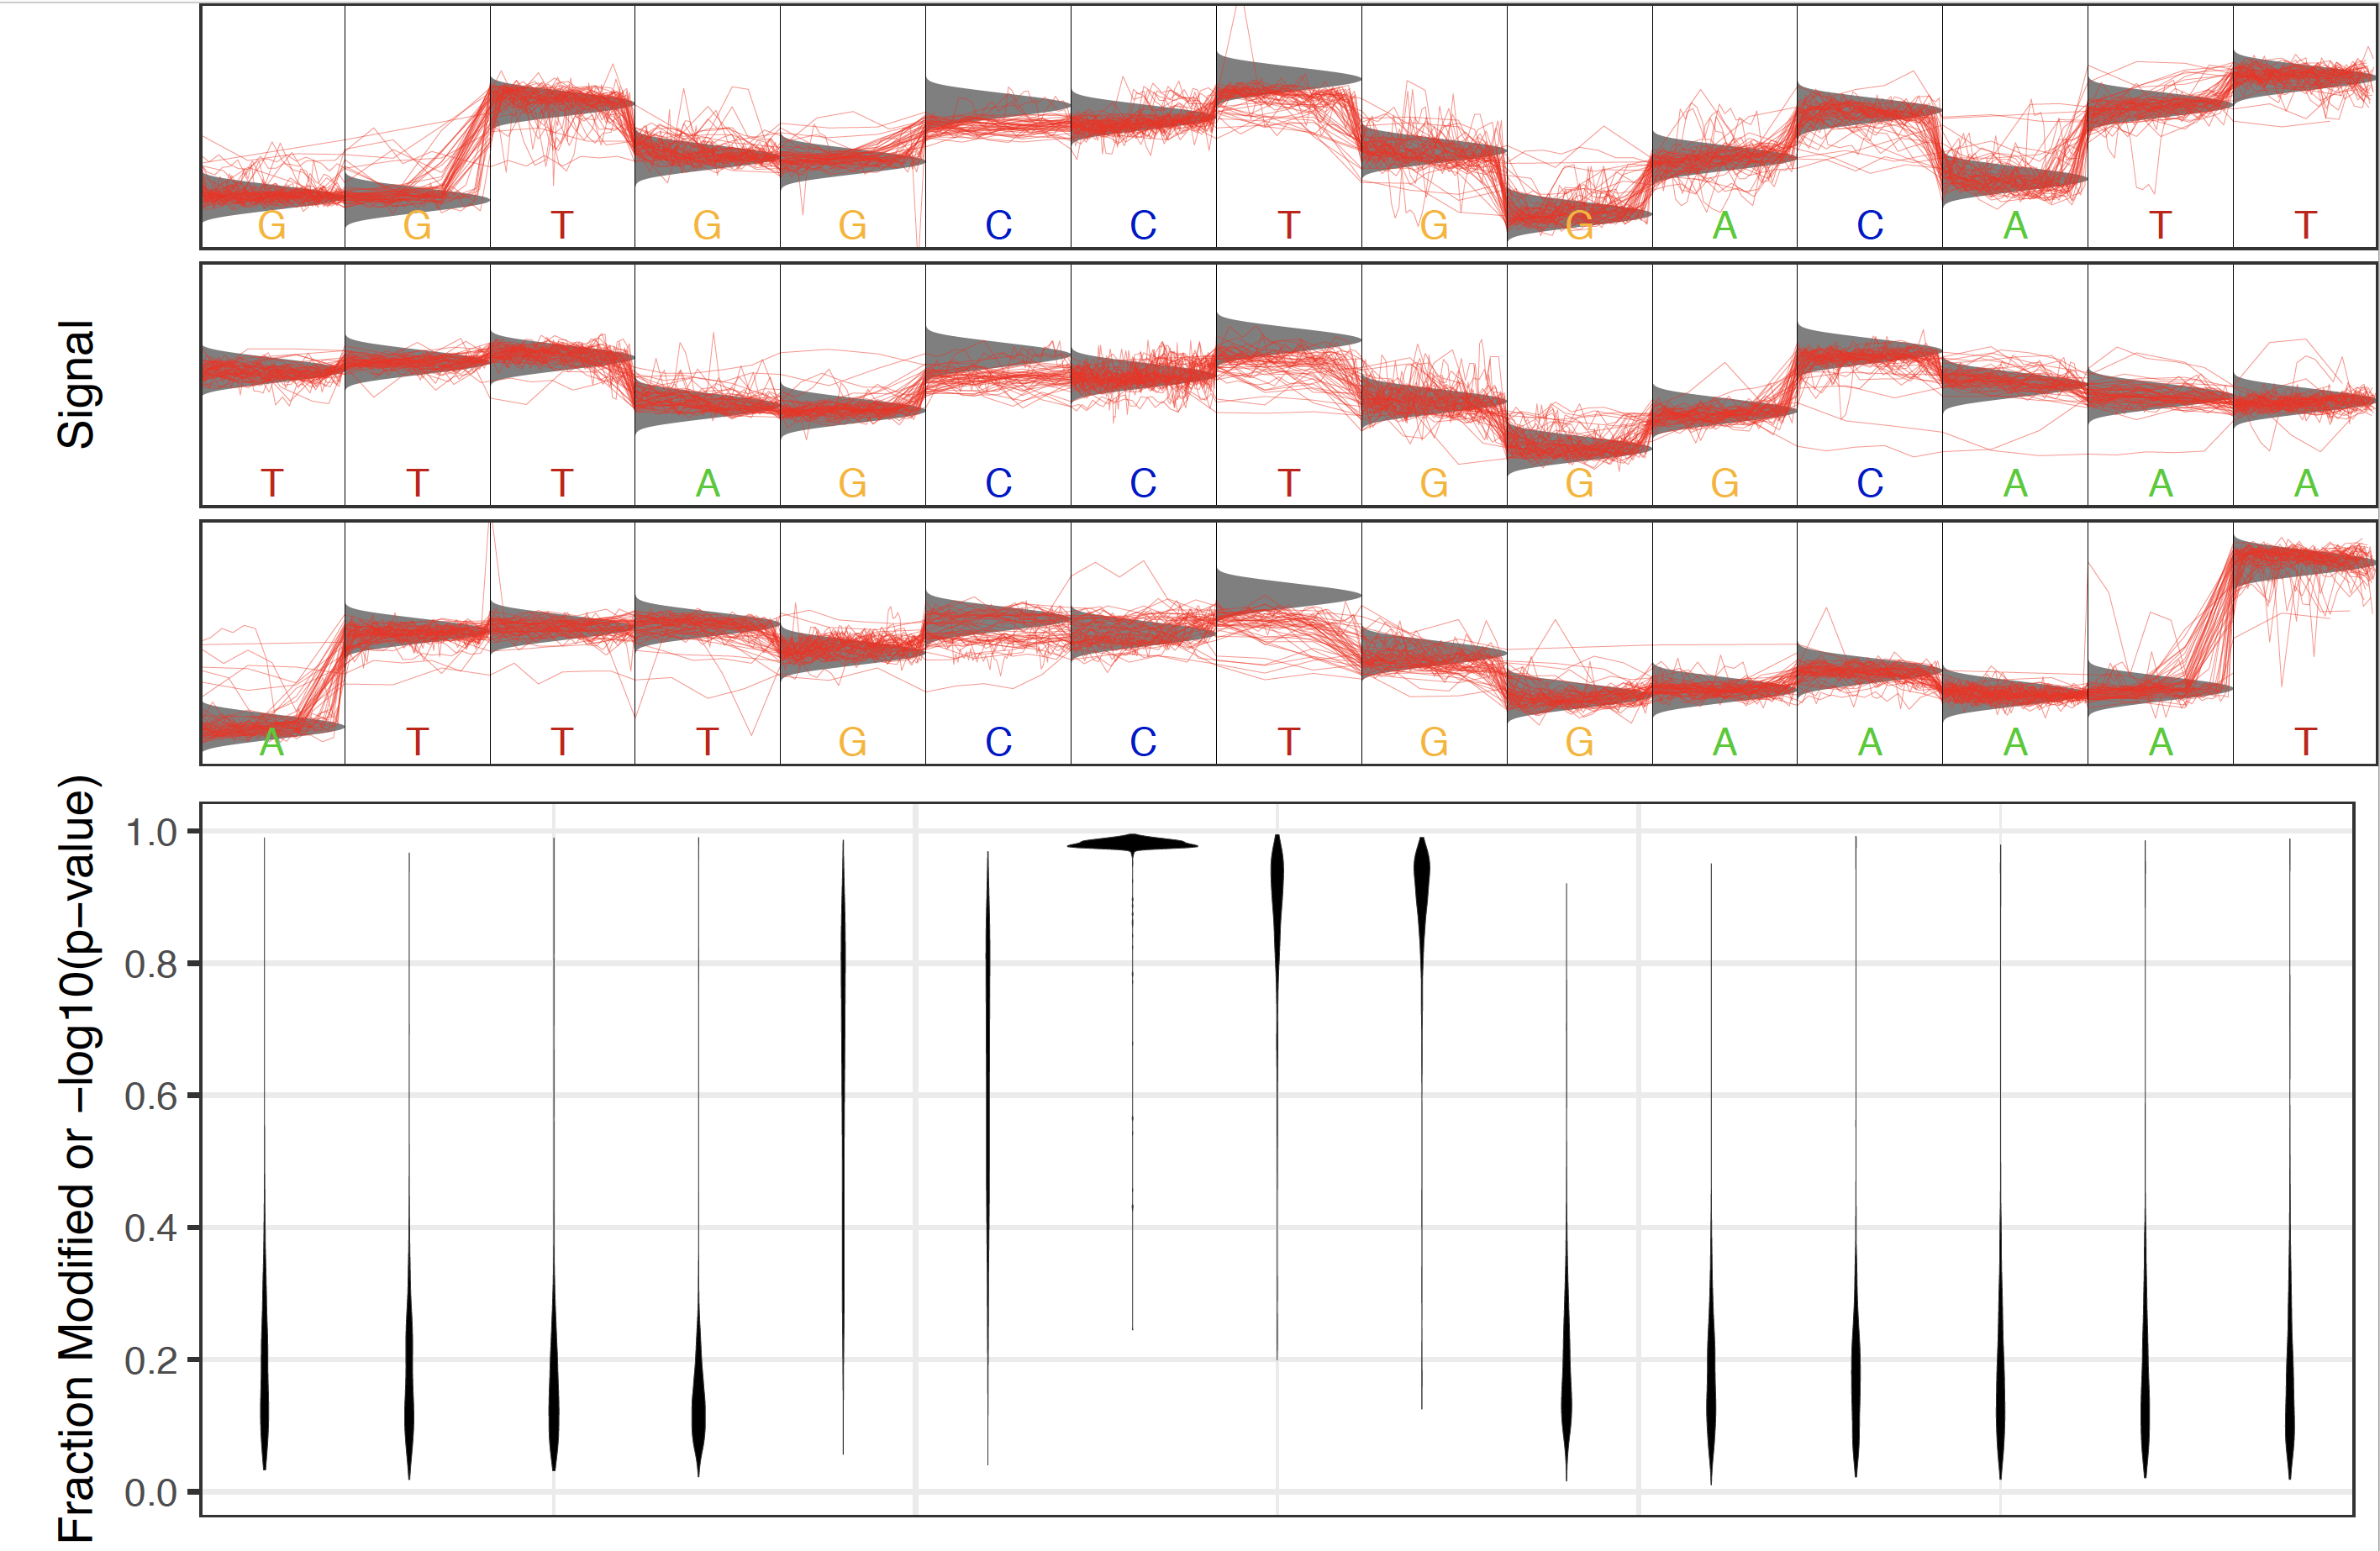
Example statistics distribution around biologically relevant CCWGG motif in E. coli
Other Plotting Commands
K-mer Signal Levels
In order to investigate the signal levels of a particular set of reads, the tombo plot kmer command is provided. This plot extracts the observed signal levels from a set of reads and groups the signal by the local genomic sequence context (k-mer) and plots the resulting distributions of signal levels.
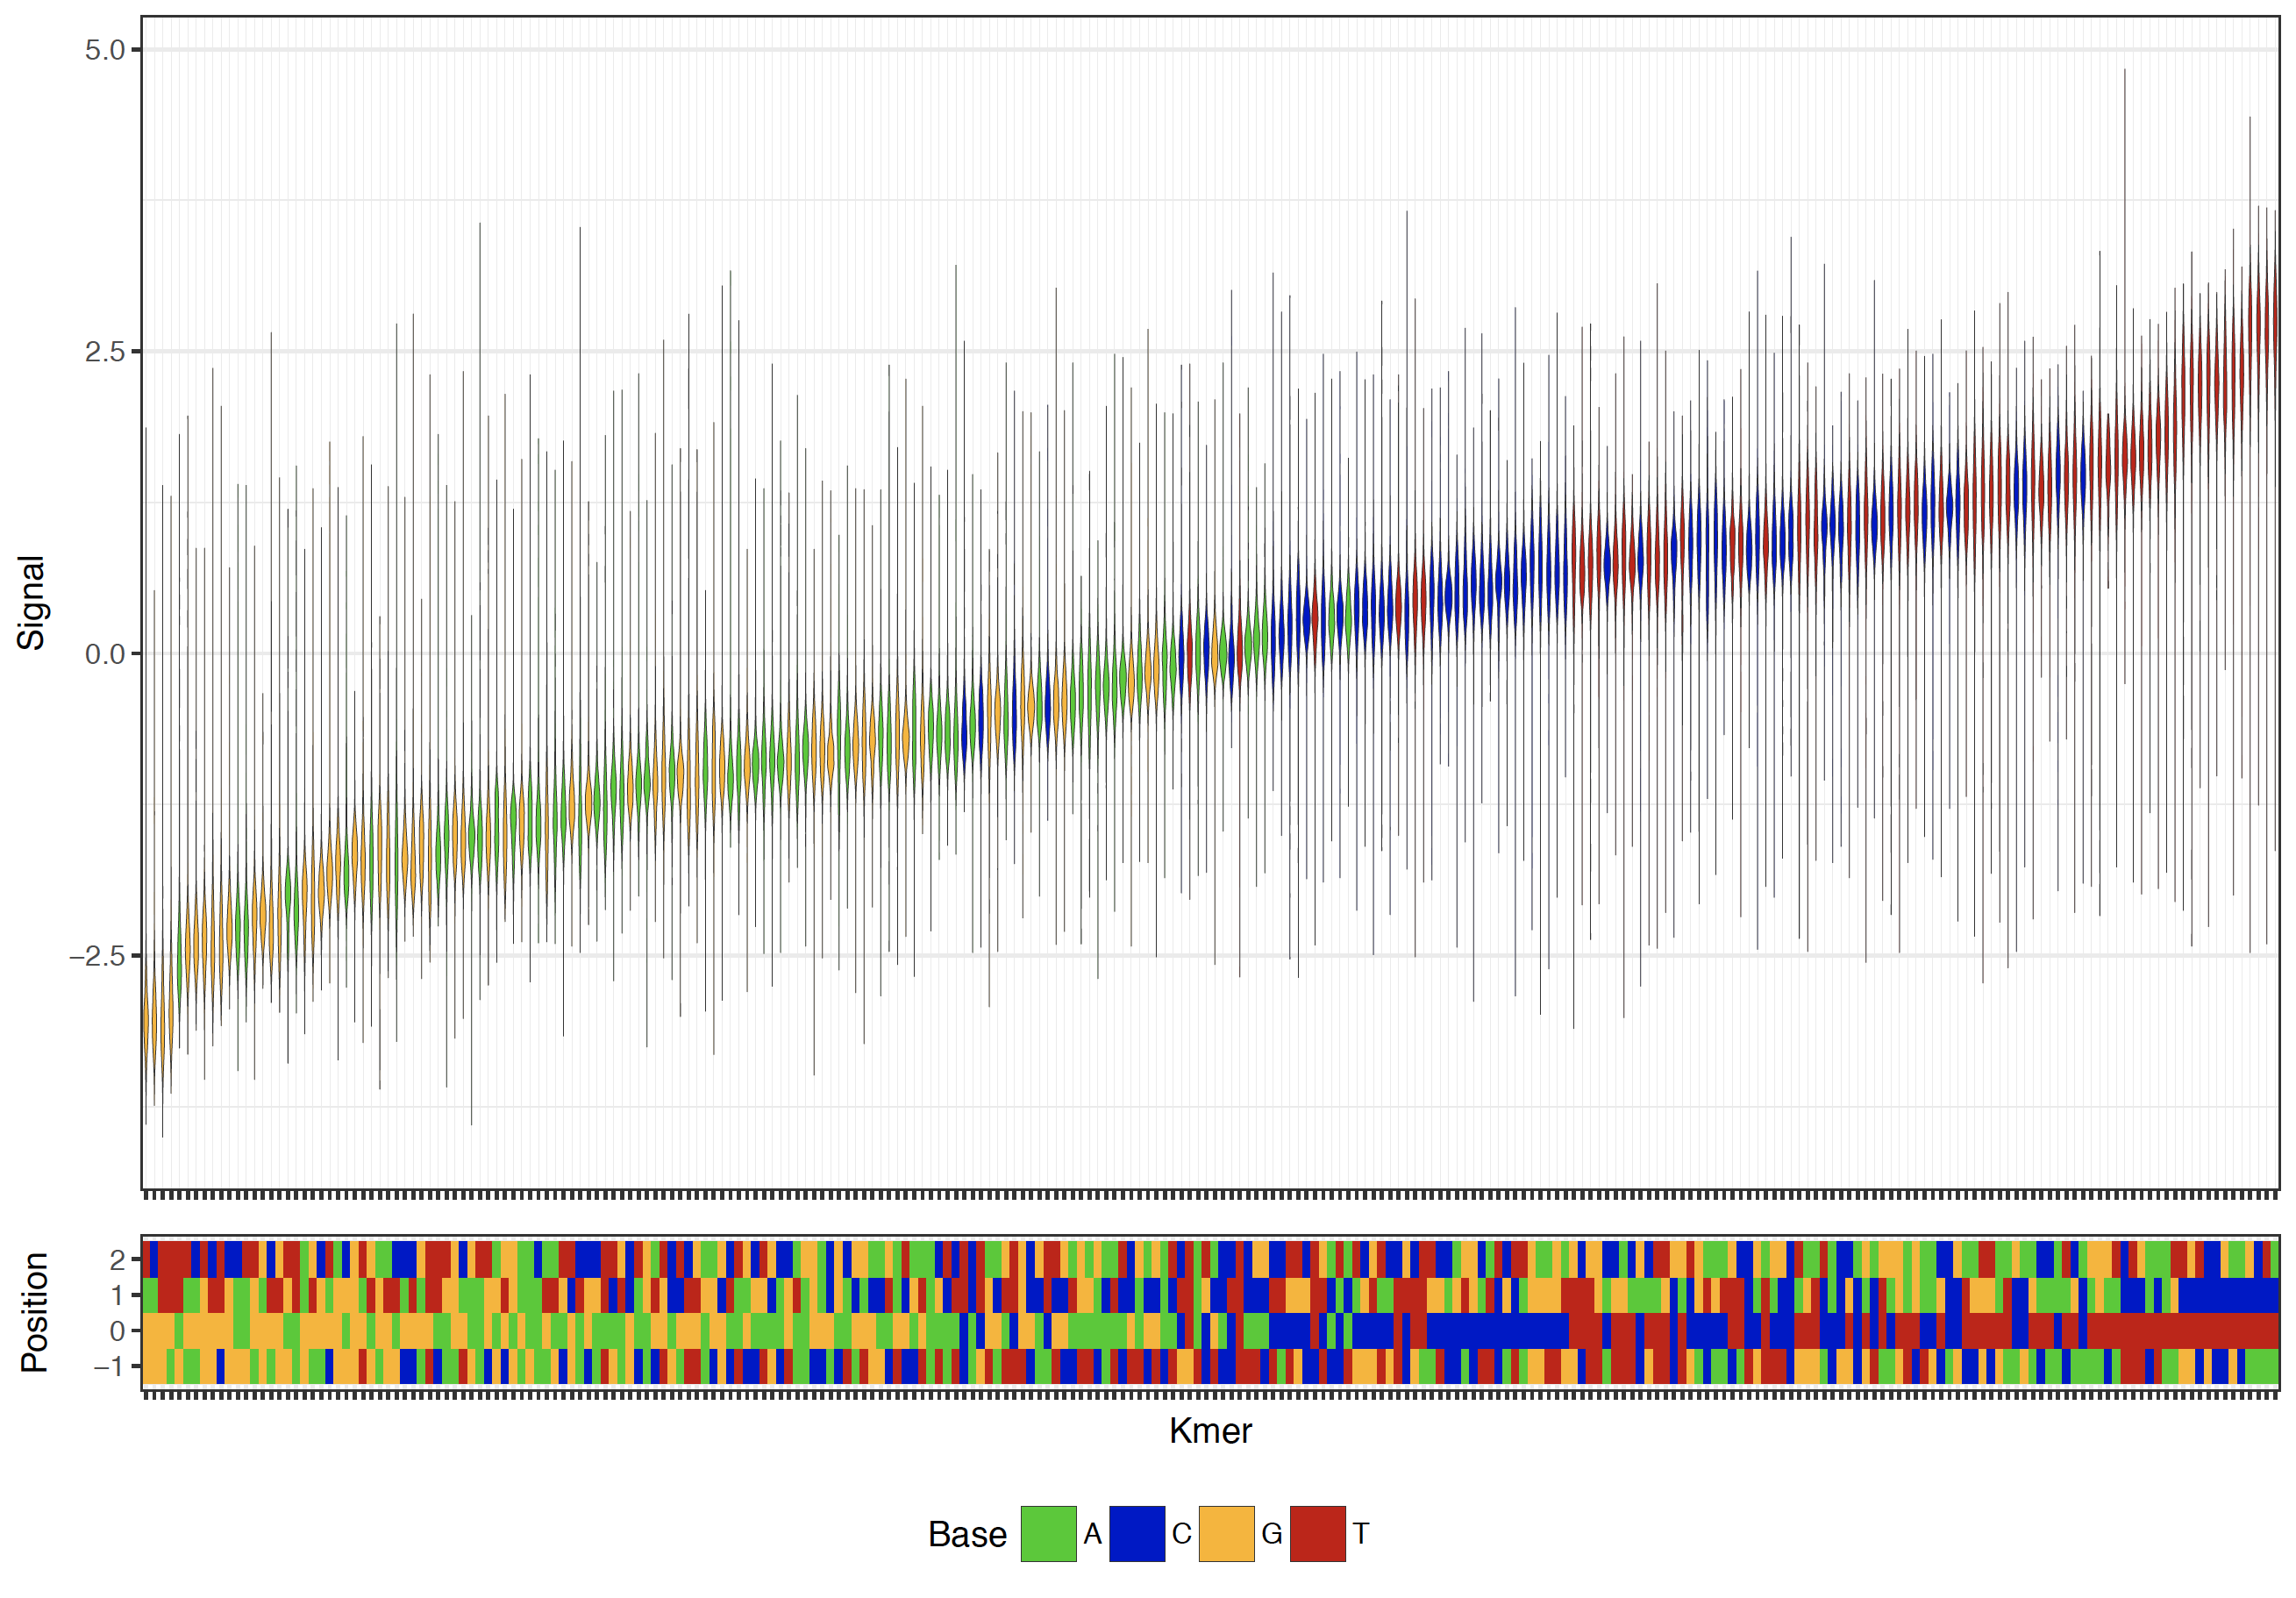
Example current level distribution plot
ROC Curves
In order to validate the performance of modified base detection results at a known sequence motif or set of ground truth locations, a set of ground truth evaluation plotting commands are prodived (roc, sample_compare_roc, per_read_roc, and sample_compare_per_read_roc). Each of these commands produced both a receiver operating characteristic (ROC) curve as well as a Precision-Recall curve. This command also outputs a table of area under the curve (AUC) and mean average precision (mean AP) for all provided ground truth sets.
For the roc and per_read_roc commands ground truth sites are compared to modified base statistics at all other “swap base” sites in the genome. Users should be aware that for more specific motifs the AUC statistic may be somewhat misleading and are not directly comparable from one motif to the next. The sample_compare_roc, and sample_compare_per_read_roc commands instead use a separate control sample as the ground truth and includes only sites at the ground truth motif. This creates balanced validation metrics that are more comparable between two motifs and/or modifications.
Below is an example command and resulting plot for identifying the known dam and dcm methylase contexts in E. coli using all three provided testing methods.
tombo plot roc --statistics-filenames \
    native.sample_comp.tombo.stats \
    native.de_novo.tombo.stats \
    native.alt.5mC.tombo.stats \
    native.alt.6mA.tombo.stats \
    --motif-descriptions \
    CCWGG:2:"dcm 5mC Sample Compare"::GATC:2:"dam 6mA Sample Compare" \
    CCWGG:2:"dcm 5mC De Novo"::GATC:2:"dam 6mA De Novo" \
    CCWGG:2:"dcm 5mC Alt. Model" \
    GATC:2:"dam 6mA Alt. Model" \
    --genome-fasta e_coli.fasta
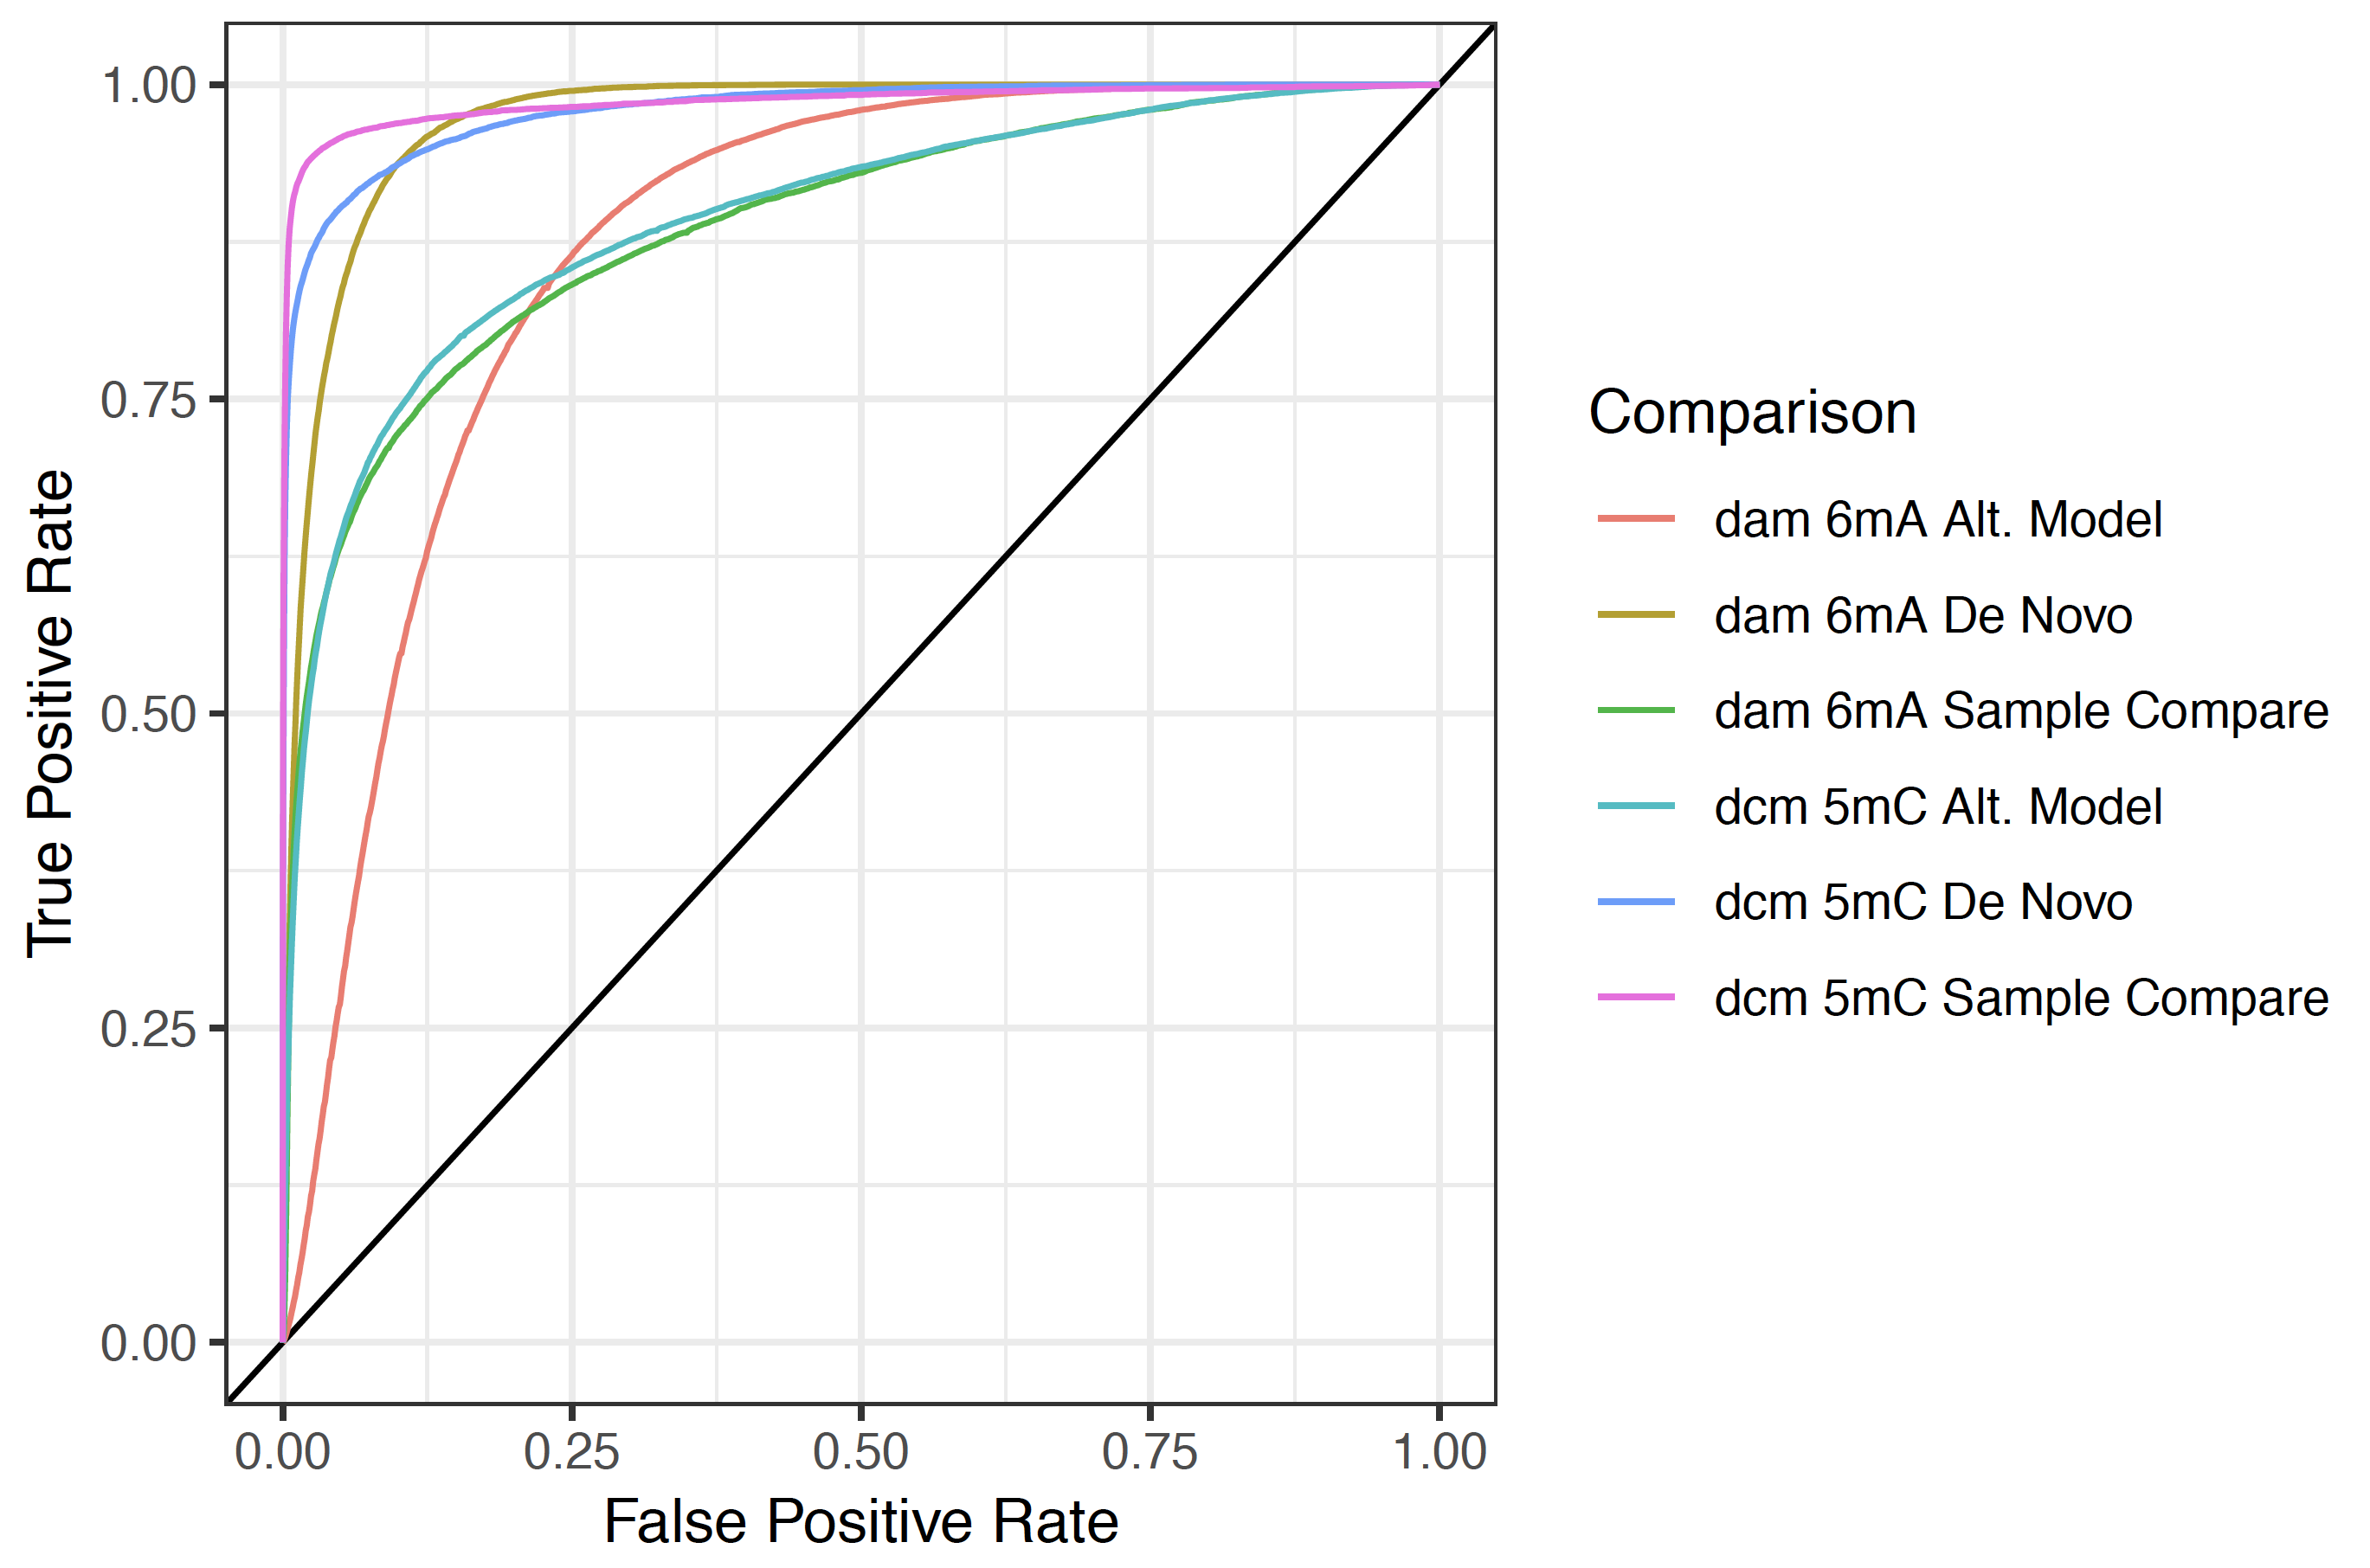
Example ROC curve plot
For the per-read ROC plots, along with ROC and precision-recall curves these commands plot a distribution of test statistics for motif-matching and non-motif-matching sites for each motif provided (see figure below). These plots can be very useful in picking a --single-read-threshold for use in either the detect_modifications or aggregate_per_read_stats commands.
tombo plot per_read_roc \
    --statistics-filenames vs_pcr.tombo.per_read_stats de_novo.tombo.per_read_stats \
    5mC_model.5mC.tombo.per_read_stats 6mA_model.6mA.tombo.per_read_stats \
    --motif-descriptions CCWGG:2:"dcm 5mC Sample Comp"::GATC:2:"dam 6mA Sample Comp" \
    CCWGG:2:"dcm 5mC De novo"::GATC:2:"dam 6mA De novo" \
    CCWGG:2:"dcm 5mC Alt Comp" GATC:2:"dam 6mA Alt Comp"  \
    --genome-fasta e_coli.fasta
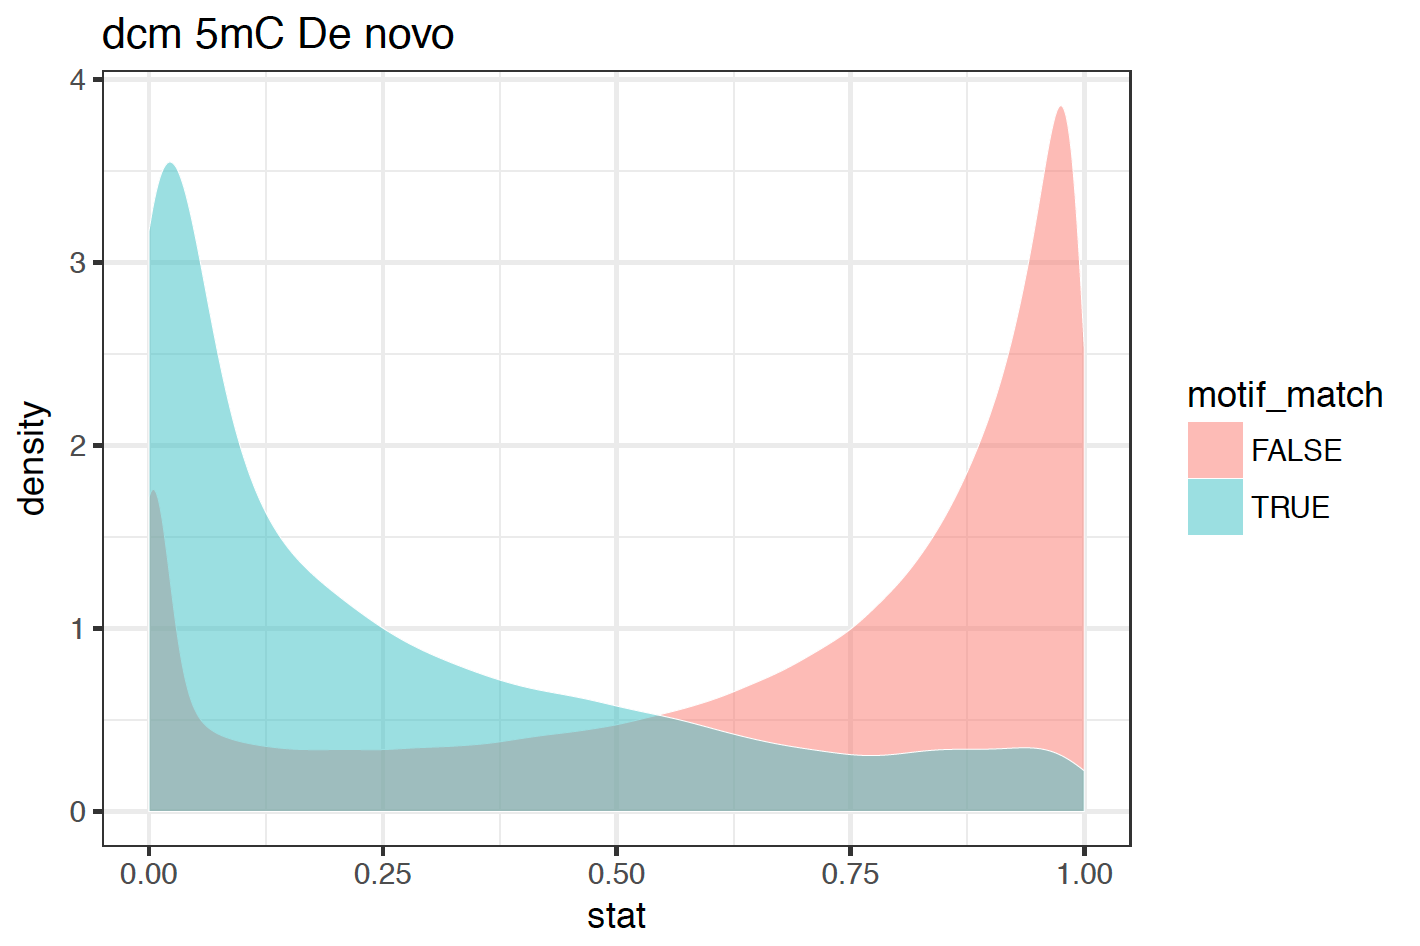
Example per-read statistic distribution